

Invest in the best stock opportunities right now and every-time.
Start Systematic Stock Investing ...in less than a minute.

BSE: 500112 | NSE: SBIN | Bank - Public | Large Cap


Past 10 year's financial track record analysis by Moneyworks4me indicates that State Bank Of India is a good quality company.
The key valuation ratios of State Bank Of India's currently when compared to its past seem to suggest it is in the Somewhat overvalued zone.
The Price Trend analysis by MoneyWorks4Me indicates it is Semi Strong which suggest that the price of State Bank Of India is likely to Rise-somewhat in the short term. However, please check the rating on Quality and Valuation before investing.
Data adjusted to bonus, split, extra-ordinary income, rights issue and change in financial year end.
| Mar'15 | Mar'16 | Mar'17 | Mar'18 | Mar'19 | Mar'20 | Mar'21 | Mar'22 | Mar'23 | Mar'24 | TTM | ||
|---|---|---|---|---|---|---|---|---|---|---|---|---|
| Net Interest Income (₹ Cr.) | 55,015 | 57,195 | 61,860 | 74,854 | 88,349 | 98,085 | 1,10,710 | 1,20,708 | 1,44,841 | 1,59,876 | 1,65,846 | |
| YoY Gr. Rt. % | - | 4% | 8.2% | 21% | 18% | 11% | 12.9% | 9% | 20% | 10.4% | - | |
| Total Income | 1,74,973 | 1,91,844 | 2,10,979 | 2,65,100 | 2,79,644 | 3,02,545 | 3,08,647 | 3,16,021 | 3,68,719 | 4,66,813 | 5,08,708 | |
| YoY Gr. Rt. % | - | 9.6% | 10% | 25.7% | 5.5% | 8.2% | 2% | 2.4% | 16.7% | 26.6% | - | |
| Adj EPS (₹ ) | 17.6 | 12.8 | 13.2 | -7.3 | 1 | 16.2 | 22.9 | 35.5 | 56.3 | 68.4 | 81.8 | |
| YoY Gr. Rt. % | - | -27% | 2.6% | -155.8% | NA | 1573.2% | 40.9% | 55.2% | 58.6% | 21.6% | - | |
| BVPS (₹ ) | 172 | 185.9 | 196.5 | 217.7 | 219.9 | 233.3 | 258.1 | 287.6 | 336 | 391.8 | 457 | |
| YoY Gr. Rt. % | - | 8% | 5.8% | 10.8% | 1% | 6.1% | 10.6% | 11.5% | 16.8% | 16.6% | - | |
| To view Net Profit/Total Funds (%) Colour Rating Guide click here ⓘ | ||||||||||||
| Net Profit/Total Funds (%) | 0.7 | 0.5 | 0.4 | -0.2 | 0 | 0.4 | 0.5 | 0.7 | 1 | 1 | 1 | |
| To view Net NPA to Net Advances (%) Colour Rating Guide click here ⓘ | ||||||||||||
| Net NPA to Net Advances (%) | 2.1 | 3.8 | 3.7 | 5.7 | 3 | 2.2 | 1.5 | 1 | 0.7 | 0.6 | 0.5 | |
| To view Capital Adequacy Ratio (%) Colour Rating Guide click here ⓘ | ||||||||||||
| Capital Adequacy Ratio (%) | - | - | - | - | - | - | - | - | - | - | - | |
CAGR Colour Code Guide ⓘ
| 9 Years | 5 Years | 3 Years | 1 Years | |||||
|---|---|---|---|---|---|---|---|---|
| Net Interest Income | 12.6% | 12.6% | 13% | 10.4% | ||||
| Total Income | 11.5% | 10.8% | 14.8% | 26.6% | ||||
| Adj EPS | 16.3% | 134.3% | 44.1% | 21.6% | ||||
| BVPS | 9.6% | 12.3% | 14.9% | 16.6% | ||||
| Share Price | 11.3% | 31.5% | 15.8% | 2.5% | ||||
| RATIOS \ YEARS | Mar'15 | Mar'16 | Mar'17 | Mar'18 | Mar'19 | Mar'20 | Mar'21 | Mar'22 | Mar'23 | Mar'24 | TTM | |
|---|---|---|---|---|---|---|---|---|---|---|---|---|
| Interest Earned / Total Income | 87.1 | 85.49 | 83.19 | 83.18 | 86.85 | 85.05 | 85.91 | 87.16 | 90.07 | 88.93 | 89.2 | |
| Margins | To view Margins Colour Rating Guide click here ⓘ | |||||||||||
| NIM (%) | 2.8 | 2.6 | 2.5 | 2.4 | 2.6 | 2.7 | 2.7 | 2.6 | 2.9 | 2.8 | 2.5 | |
| Performance Ratios | To view Performance Ratios Colour Rating Guide click here ⓘ | |||||||||||
| Return on Equity (%) | 10.6 | 7.3 | 7 | -3.7 | 0.4 | 7.2 | 9.3 | 13 | 18.1 | 18.8 | 15.5 | |
| Liquidity Ratio | To view Liquidity Ratio Colour Rating Guide click here ⓘ | |||||||||||
| CASA (%) | 41.3 | 42.6 | 44.6 | 44.5 | 44.6 | 44.2 | 45.4 | 44.5 | 42.7 | 39.9 | - | |
Return on Equity has increased versus last 3 years average to 19.30%
Total Income has increased 14.79 CAGR in last 3 years
Net Profit has increased 44.11 CAGR in last 3 years
Net NPA to Net Advances has declined versus last 3 years average
Total income growth is good in last 4 quarters
No data to display
| Standalone | Consolidated | |
|---|---|---|
| TTM EPS (₹) | 81.8 | 88.9 |
| TTM Sales (₹ Cr.) | 4,53,866 | 4,81,410 |
| BVPS (₹.) ⓘ | 457 | 507.2 |
| Reserves (₹ Cr.) ⓘ | 4,06,958 | 4,51,743 |
| P/BV ⓘ | 1.69 | 1.52 |
| PE ⓘ | 9.45 | 8.69 |
| From the Market | |
|---|---|
| 52 Week Low / High (₹) | 679.65 / 912.10 |
| All Time Low / High (₹) | 13.20 / 912.10 |
| Market Cap (₹ Cr.) | 6,89,338 |
| Equity (₹ Cr.) | 892.5 |
| Face Value (₹) | 1 |
| Industry PE ⓘ | 8.4 |
| Mar'24 | YoY Gr. Rt. % | Jun'24 | YoY Gr. Rt. % | Sep'24 | YoY Gr. Rt. % | Dec'24 | YoY Gr. Rt. % | |
|---|---|---|---|---|---|---|---|---|
| Net Interest Income (₹ Cr.) | 41,655 | 3.1 | 41,125 | 5.7 | 41,620 | 5.4 | 41,446 | 4.1 |
| Interest Earned (₹ Cr.) | 1,11,043 | 19.5 | 1,11,526 | 16.2 | 1,13,871 | 12.3 | 1,17,427 | 10 |
| Total Income (₹ Cr.) | 1,28,412 | 20.1 | 1,22,688 | 13.6 | 1,29,141 | 15.1 | 1,28,467 | 8.7 |
| Adj EPS (₹) | 20.3 | 23.6 | 16.8 | 7 | 16 | 12.6 | 18 | 36.4 |
| NIM (%) | 3.47 | - | 3.35 | - | 3.31 | - | 3.01 | - |
| Net NPA to Net Advances (%) | 0.57 | - | 0.57 | - | 0.53 | - | 0.53 | - |
| CASA (%) | 41.11 | - | 40.70 | - | 40.03 | - | 39.20 | - |
| Pledged * | 0.00 | 0.00 | 0.00 | 0.00 | 0.00 | 0.00 | 0.00 | 0.00 | 0.00 | 0.00 |
* Provisions on account of one-time increase in pension liabilities at uniform rate of 50% and Dearness Relief (DR) Neutralization

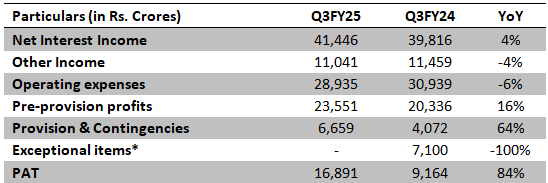
Key Highlights – Strong Performance Continues
Advances Growth:
Total advances grew 13% YoY to Rs. 40.67 lakh crores.
Domestic advances increased by 14% YoY, driven by 19% growth in SME advances and 15% growth in agricultural advances.
Corporate advances grew 15% YoY, while retail personal advances expanded by 12% YoY.
Foreign office advances saw a 10% YoY increase.
Deposits and CASA:
Total deposits rose 10% YoY to Rs. 52.29 lakh crores.
CASA deposits grew 4% YoY, but CASA ratio declined to 39.20% from 41.18% YoY.
Term deposits increased 13 % YoY, reflecting a shift from CASA to higher-yielding fixed deposits.
Current account balances grew 14% YoY, showing continued traction.
Margins and Asset Quality:
Net Interest Margin (NIM) for Q3 FY25 stood at 3.01%, while domestic NIM was 3.15%, declining YoY due to higher funding costs.
Gross NPA ratio improved to 2.07%, down 35 bps YoY.
Net NPA ratio stood at 0.53%, improving by 11 bps YoY.
Provision Coverage Ratio (PCR) stood at 74.66%, reflecting strong provisioning.
Credit cost for Q3 FY25 was 0.24%, indicating disciplined risk management.
Profitability:
Net profit surged 84% YoY to Rs. 16,891 crores, reflecting strong operational performance.
Operating profit increased 16% YoY to Rs. 23,551 crores.
ROA improved to 1.04% and ROE stood at 21.46% for 9M FY25.
Net Interest Income (NII) increased 4% YoY, supported by loan book growth.
Capital Adequacy and Liquidity:
Capital Adequacy Ratio (CAR) stood at 13.03%, with Tier-I Capital at 10.85%.
Liquidity position remains strong, supporting future credit expansion.
Key Business Segments & Digital Expansion:
Robust growth in SME, agriculture, and retail lending, reinforcing SBI’s leadership.
Strong digital banking adoption, with 98.1% of transactions through alternate channels.
YONO continues to scale, driving new customer acquisition and operational efficiency. 64% of new savings accounts were acquired digitally through YONO, highlighting the bank’s digital focus.
The country's largest bank reported its highest-ever annual profit of Rs 61,077 crore, marking a 22% improvement YoY. The net profit for Q4FY24 was particularly strong, standing at Rs 20,698 crore, a rise of 23.98% YoY. The Return on Assets (ROA) for FY24 was at 1.04%, up by 8 basis points YoY, and the Return on Equity (ROE) reached 20.32%, up by 89 basis points YoY.
Loan Growth
As of March, SBI’s overall advances grew by 15% YoY, reaching a balance sheet size of ?62 trillion. The growth was driven by a 14.7% increase in retail loans. Additionally, loans in the small business and agriculture sectors rose by 20.5% and 17.9% respectively. The corporate segment, which makes up 35% of the bank's domestic loan portfolio, also experienced strong growth, rising by 16% YoY. Consequently, the bank's overall loan book in India expanded by 16.3% YoY in FY24.

SBI Chairman Dinesh Kumar Khara expects FY24’s loan growth to sustain in FY25 and net interest margin maintained at the current level. In FY25, management guided a credit growth in the range of 13 -15% (15.24 % in FY24) and 12-13% rise in deposits (11.13 % in FY24).
Capital Adequacy
At the analyst meeting, Mr. Khara noted that the current capital adequacy ratio, which stood at 14.28% as of March 2024, is sufficient to support up to ?7 lakh crore of balance sheet growth. However, the bank is open to raising equity capital if necessary. The capital adequacy ratio measures a bank's capital against its risk-weighted assets and indicates how well the bank is capitalized both to absorb potential losses from bad assets and to support growth.
Deposit Growth
SBI is well-positioned relative to its peers, with a credit-to-deposit ratio (CD ratio) of 68% on its domestic book, which is significantly lower than the banking industry's average CD ratio. However, the CASA ratio for SBI has decreased from 43.80% to 41.11% in FY24.

SBI has observed an upward trend in its domestic cost of deposits over the past four quarters, a factor that directly influences the bank's net interest margin (NIM)—a critical measure of profitability. As of Q4, the cost of deposits stood at 4.81%, a slight increase from 4.75% in the previous quarter.
Management has indicated comfort with a credit-to-deposit (CD) ratio of up to 75%. Although SBI's domestic margin currently falls below those of larger private sector peers like ICICI Bank, there is potential to enhance margins by increasing the CD ratio in the future.
Asset Quality
SBI's asset quality has shown improvement, evidenced by a decline in both gross and net non-performing asset ratios (GNPA and NNPA). Furthermore, the slippage ratio—indicative of fresh accretion to NPAs—has not only moderated over the past few years but also reached a record low in FY24. As a result, the credit cost has further declined. A key consideration going forward is whether SBI can sustain these record-low levels of credit cost.

Operating Income
Operating expenses at SBI rose by 20% year-over-year in FY24, primarily driven by wage revisions and pension-related provisions. As a result, the cost-to-income ratio (C/I) reached approximately 56% for the fiscal year. Excluding the impact of wage revisions and a one-time item, the C/I ratio would have been around 49%.

|
Particulars |
Q1FY24 |
YoY Trend |
Comments |
|
Advances |
33,03,731 |
+14% |
Growth across segments, driven by retail personal and agri verticals |
|
Net Interest Income |
38,905 |
+25% |
|
|
PAT |
16,884 |
+178% |
PAT almost doubled largely due to treasury gains |
Company delivered strong performance with healthy PAT growth and 1.22% RoA (return on assets). Management guided ~15% YoY credit growth for FY24.
|
|
Q4FY23 |
% Change YoY |
Comments |
|
Advances |
31,99,269 |
17.0% |
|
|
Deposits |
44,23,777 |
9.2% |
|
|
Net Interest Income (NII) |
40,392.5 |
29.5% |
NIM at 3.84% |
|
Gross Non-Performing Asset (GNPA) |
2.78% |
-118 bps |
|
|
Profit after tax (PAT) |
16,694.5 |
83.2% |
|
Results were good on account of GNPA improvement.
State Bank of India Ltd
Market Cap 545,829Cr
CMP 612
P/B 1.84xFY23
|
Results |
(INR Cr) |
YoY Growth |
Comments |
|
Advances |
30,35,071 |
19.93% |
Healthy loan growth across all segments |
|
Net Interest Income |
35,183 |
12.83% |
NIM improved by 8bps to 3.32% on yearly basis |
|
Net Profit |
13,264.62 |
76% |
Provisions declined by 25.5% to 2,011 Cr |
Key Highlights
State Bank of India | Market Cap: Rs. 4,59,662 Cr
CMP 515 | P/B 1.7x FY23
|
Results |
(Rs. Cr) |
Y-o-Y Growth |
Comments |
|
Advance |
28,76,456 |
15.8% |
Healthy growth in retail segment (18.6%), led by robust growth in Home loans (14%) and Xpress Credit (32%). |
|
Net Interest Income |
31,196 |
13% |
Benefit from the re-pricing of floating rate loan portfolio |
|
Net Profit |
6,068 |
-7% |
Dragged down by MTM loss of Rs. 6,550 Cr on treasuries and a slight decline in margin |
Key highlights:
Management Outlook
| Company Name | CMP(₹) | |||||||
|---|---|---|---|---|---|---|---|---|
| SBI | 771.6 | -0.8 (-0.1%) | Large Cap | 4,15,131 | 81.8 | 14.7 | 9.5 | 1.7 |
| Bank Of Baroda | 228.4 | -2.4 (-1%) | Large Cap | 1,12,606 | 37.6 | 15.8 | 6.1 | 0.9 |
| Canara Bank | 89 | -0.6 (-0.7%) | Large Cap | 1,10,519 | 18.1 | 13.4 | 5 | 0.9 |
| PNB | 96.1 | -0.3 (-0.3%) | Large Cap | 1,09,065 | 14.7 | 7.6 | 6.6 | 0.9 |
| Union Bank Of India | 126.2 | 2.1 (1.7%) | Large Cap | 99,778 | 21.4 | 13.7 | 5.8 | 0.9 |
| Indian Overseas Bank | 39 | -2.8 (-6.6%) | Large Cap | 24,050 | 1.6 | 11 | 26 | 3 |
| PARTICULARS | Mar'15 | Mar'16 | Mar'17 | Mar'18 | Mar'19 | Mar'20 | Mar'21 | Mar'22 | Mar'23 | Mar'24 |
|---|---|---|---|---|---|---|---|---|---|---|
| Income | 1,74,973 | 1,91,844 | 2,10,979 | 2,65,100 | 2,79,644 | 3,02,545 | 3,08,647 | 3,16,021 | 3,68,719 | 4,66,813 |
| Interest Income | 1,52,397 | 1,63,998 | 1,75,518 | 2,20,499 | 2,42,869 | 2,57,324 | 2,65,151 | 2,75,457 | 3,32,103 | 4,15,131 |
| Other Income ⓘ | 22,576 | 27,845 | 35,461 | 44,601 | 36,775 | 45,221 | 43,496 | 40,564 | 36,616 | 51,682 |
| Expenditure | 1,61,871 | 1,81,893 | 2,00,495 | 2,71,647 | 2,78,781 | 2,88,057 | 2,88,237 | 2,84,345 | 3,18,486 | 4,05,736 |
| Interest Expense | 97,382 | 1,06,803 | 1,13,659 | 1,45,646 | 1,54,520 | 1,59,239 | 1,54,441 | 1,54,750 | 1,87,263 | 2,55,255 |
| Operating Expenses | 38,054 | 41,782 | 46,473 | 59,943 | 69,688 | 75,174 | 82,652 | 93,398 | 97,743 | 1,24,861 |
| Provisions | 26,436 | 33,307 | 40,364 | 66,058 | 54,574 | 53,645 | 51,144 | 36,198 | 33,481 | 25,621 |
| Profit Before Tax | 19,314 | 13,774 | 14,855 | -15,528 | 2,307 | 24,802 | 27,541 | 43,422 | 67,206 | 81,783 |
| Taxes | 6,212 | 3,823 | 4,371 | -8,981 | 1,445 | 10,314 | 7,131 | 11,746 | 16,973 | 20,706 |
| Profit After Tax | 13,102 | 9,951 | 10,484 | -6,547 | 862 | 14,488 | 20,410 | 31,676 | 50,232 | 61,077 |
| Adjusted EPS (₹) | 17.55 | 12.82 | 13.15 | -7.34 | 0.97 | 16.23 | 22.87 | 35.49 | 56.29 | 68.44 |
| Dividend Payout Ratio (%) | 20% | 20% | 20% | 0% | 0% | 0% | 17% | 20% | 20% | 20% |
| PARTICULARS | Mar'15 | Mar'16 | Mar'17 | Mar'18 | Mar'19 | Mar'20 | Mar'21 | Mar'22 | Mar'23 | Mar'24 |
|---|---|---|---|---|---|---|---|---|---|---|
Equity and Liabilities | ||||||||||
| Share Capital ⓘ | 747 | 776 | 797 | 892 | 892 | 892 | 892 | 892 | 892 | 892 |
| Total Reserves ⓘ | 1,27,692 | 1,43,498 | 1,87,489 | 2,18,236 | 2,20,021 | 2,31,115 | 2,52,983 | 2,79,196 | 3,26,716 | 3,76,354 |
| Minority Interest | 0 | 0 | 0 | 0 | 0 | 0 | 0 | 0 | 0 | 0 |
| Deposits | 15,76,793 | 17,30,722 | 20,44,751 | 27,06,343 | 29,11,386 | 32,41,621 | 36,81,277 | 40,51,534 | 44,23,778 | 49,16,077 |
| Borrowings ⓘ | 2,05,150 | 3,23,345 | 3,17,694 | 3,62,142 | 4,03,017 | 3,14,656 | 4,17,298 | 4,26,043 | 4,93,135 | 5,97,561 |
| Other Liabilities | 1,37,698 | 1,59,276 | 1,55,235 | 1,67,138 | 1,45,597 | 1,63,110 | 1,81,980 | 2,29,932 | 2,72,457 | 2,88,809 |
| Total Liabilities ⓘ | 20,48,080 | 23,57,617 | 27,05,966 | 34,54,752 | 36,80,914 | 39,51,394 | 45,34,430 | 49,87,597 | 55,16,979 | 61,79,694 |
Assets | ||||||||||
| Balance with RBI | 1,15,884 | 1,29,629 | 1,27,998 | 1,50,397 | 1,76,932 | 1,66,736 | 2,13,202 | 3,18,265 | 2,47,088 | 2,25,142 |
| Balance with Banks | 38,872 | 37,838 | 43,974 | 41,501 | 45,558 | 84,361 | 1,29,837 | 76,287 | 60,812 | 85,660 |
| Investments ⓘ | 4,81,759 | 5,75,652 | 7,65,990 | 10,60,987 | 9,67,022 | 10,46,954 | 13,51,705 | 14,81,445 | 15,70,366 | 16,71,340 |
| Advances | 13,00,026 | 14,63,700 | 15,71,078 | 19,34,880 | 21,85,877 | 23,25,290 | 24,49,498 | 27,33,967 | 31,99,269 | 37,03,971 |
| Net Block ⓘ | 9,042 | 9,819 | 42,345 | 39,201 | 38,509 | 38,023 | 38,067 | 37,467 | 42,101 | 42,126 |
| Other Assets | 1,02,210 | 1,40,408 | 1,54,008 | 2,26,994 | 2,66,328 | 2,89,614 | 3,51,769 | 3,39,925 | 3,97,062 | 4,50,964 |
| Total Assets ⓘ | 20,48,080 | 23,57,617 | 27,05,966 | 34,54,752 | 36,80,914 | 39,51,394 | 45,34,430 | 49,87,597 | 55,16,979 | 61,79,694 |
| PARTICULARS | Mar'15 | Mar'16 | Mar'17 | Mar'18 | Mar'19 | Mar'20 | Mar'21 | Mar'22 | Mar'23 | Mar'24 |
|---|---|---|---|---|---|---|---|---|---|---|
| Cash Flow From Operating Activity ⓘ | 27,621 | 11,197 | 11,060 | -85,425 | 34,628 | 25,688 | 89,866 | 58,415 | -91,352 | 19,022 |
| Cash Flow From Investing Activity ⓘ | -3,258 | -3,748 | -3,148 | 879 | -3,959 | -2,977 | -3,354 | -2,613 | -3,297 | -3,053 |
| Cash Flow From Financing Activity ⓘ | -2,289 | 4,506 | -1,780 | 4,291 | -1,088 | 3,352 | 5,633 | -5,178 | 5,202 | -13,855 |
| Net Cash Flow ⓘ | 22,074 | 11,954 | 6,132 | -80,255 | 29,581 | 26,063 | 92,144 | 50,625 | -89,447 | 2,114 |
| PARTICULARS | Mar'15 | Mar'16 | Mar'17 | Mar'18 | Mar'19 | Mar'20 | Mar'21 | Mar'22 | Mar'23 | Mar'24 |
|---|---|---|---|---|---|---|---|---|---|---|
Operational & Financial Ratios |
||||||||||
| EPS (₹) | 18 | 13 | 13 | -7 | 1 | 16 | 23 | 35 | 56 | 68 |
| DPS (₹) | 4 | 3 | 3 | 0 | 0 | 0 | 4 | 7 | 11 | 14 |
| BVPS (₹) | 172 | 186 | 197 | 218 | 220 | 233 | 258 | 288 | 336 | 392 |
Margin Ratios | ||||||||||
| Yield on Advances (%) | 11.7 | 11.2 | 11.2 | 11.4 | 11.1 | 11.1 | 10.8 | 10.1 | 10.4 | 11.2 |
| Yield on Investments (%) | 8.1 | 8.3 | 7.7 | 7.9 | 8.0 | 7.3 | 6.4 | 6.0 | 6.3 | 6.9 |
| Cost of Liabilities (%) | 5.5 | 5.2 | 4.8 | 4.8 | 4.7 | 4.5 | 3.8 | 3.5 | 3.8 | 4.6 |
| NIM (%) | 2.8 | 2.6 | 2.5 | 2.4 | 2.6 | 2.7 | 2.7 | 2.6 | 2.9 | 2.8 |
| Interest Spread (%) | 6.3 | 6.0 | 6.4 | 6.7 | 6.5 | 6.6 | 7.1 | 6.6 | 6.6 | 6.6 |
Performance Ratios | ||||||||||
| ROA (%) | 0.7 | 0.5 | 0.4 | -0.2 | 0.0 | 0.4 | 0.5 | 0.7 | 1.0 | 1.0 |
| ROE (%) | 10.6 | 7.3 | 7.0 | -3.7 | 0.4 | 7.2 | 9.3 | 13.0 | 18.1 | 18.8 |
| ROCE (%) | 8.7 | 5.4 | 4.7 | -1.0 | 2.8 | 6.3 | 6.5 | 8.3 | 12.1 | 12.9 |
Efficiency Ratios | ||||||||||
| Cost to Income Ratio (%) | 49.0 | 49.1 | 47.8 | 50.2 | 55.7 | 52.5 | 53.6 | 57.9 | 53.9 | 59.0 |
| Operating Costs to Assets (%) | 1.9 | 1.8 | 1.7 | 1.7 | 1.9 | 1.9 | 1.8 | 1.9 | 1.8 | 2.0 |
Valuation Parameters | ||||||||||
| Price/Book(x) | 1.6 | 1.1 | 1.5 | 1.2 | 1.5 | 0.8 | 1.4 | 1.7 | 1.6 | 1.9 |
The origin of the State Bank of India goes back to the first decade of the nineteenth century with the establishment of the Bank of Calcutta in 1806 in Calcutta. Three years later the bank received its charter and was re-designed as the Bank of Bengal (January 02, 1809). A unique institution, it was the first joint-stock bank of British India sponsored by the Government of Bengal. The Bank of Bombay (April 15, 1840) and the Bank of Madras (July 01, 1843) followed the Bank of Bengal. These three banks remained at the apex of modern banking in India till their amalgamation as the Imperial Bank of India on January 27, 1921. The presidency Banks of Bengal, Bombay and Madras with their 70 branches were merged in 1921 to form the Imperial Bank of India. The establishment of the Reserve Bank of India as the central bank of the country in 1935 ended the quasi-central banking role of the Imperial Bank.
In 1951, when the First Five Year Plan was launched, the development of rural India was given the highest priority. The commercial banks of the country including the Imperial Bank of India had till then confined their operations to the urban sector and were not equipped to respond to the emergent needs of economic regeneration of the rural areas. In order, therefore, to serve the economy in general and the rural sector in particular, the All India Rural Credit Survey Committee recommended the creation of a state-partnered and state-sponsored bank by taking over the Imperial Bank of India, and integrating with it, the former state-owned or state-associate banks. An act was accordingly passed in Parliament in May 1955 and the State Bank of India was constituted on 1 July 1955. The State Bank of India was thus born with a new sense of social purpose. The State Bank of India was destined to act as the pacesetter in this respect and lead the Indian banking system into the exciting field of national development.
State Bank of India is an Indian multinational, public sector banking and financial services statutory body. For SBI, the interests of the common man have always remained at the core of its business. The Bank has a strong portfolio of distinctive products & services, and leverages technology to deliver and manage them in a personalized and customer centric way. State Bank of India is actively involved since 1973 in non-profit activity called Community Services Banking. All its branches and administrative offices throughout the country sponsor and participate in large number of welfare activities and social causes. The bank’s business is more than banking because it touch the lives of people anywhere in many ways.
Business area of the company
SBI provides a wide range of products and services to individuals, commercial enterprises, large corporates, public bodies, and institutional customers through its various branches and outlets, joint ventures, subsidiaries, and associate companies. It has always been in the forefront to embrace changes without losing sight of its values such as Service, Transparency, Ethics, Politeness and Sustainability
Services
Business
Awards
Milestones
1806
1809
1921
1955
2011
2014
2015-16
2016-17
2017-18
2018-19
2019-20

MoneyWorks4Me rating and ranking of funds for SIP is available to subscribers only. Moneyworks4Me is not a rating and ranking agency, however it is required that users have a way of selecting funds and building a Portfolio. The method used by it are described below to enable users to understand the logic behind the rating and ranking Subscriber will find more details on this in the various content made available from time to time. In case you need more please write to besafe@moneyworks4Me.com
MoneyWorks4Me rates and ranks mutual funds based on the following data-driven system:
Funds ranking in screeners: Performance Consistency and Quality are two parameters used for ranking funds for SIP. The ranking as follows GG, GO, GR, OG, OO, OR, RG, RO and RR.
With the same color-coded funds, the one with the higher Average 3-year rolling returns (over 5 to 10 years), the number that appears in the Performance tag, ranks higher.
Here is the summary:
The third tag Upside Potential is not relevant for SIP. It is relevant for lumpsum investments in Mutual Funds.

Make an informed decision for Stocks
Invest using an intelligent system with powerful data-driven tools that help you identify opportunities and make informed buy-hold-sell decisions
Buy quality Stocks when they are available at reasonable prices and supported by an upward price trend and Sell when they are Overvalued using the Decizen Rating System. Covers 3500+ stocks

Account Discovery
- OTP from CAMS
Account Linking for Stocks & MF
- One OTP per link Eg. NSDL, CDSL, CAMS, KFin etc.
One Click Upload for your Current Portfolio and Future Transactions!
Don't miss out! First 10 users today get it FREE

With this 4 hrs Masterclass, you’ll be able to:
 Download APP


