Stocks - Q : Quality | V : Valuation | PT : Price Trend
Funds - P : Performance | Q : Quality
Funds - P : Performance | Q : Quality
BSE: 531335 | NSE: ZYDUSWELL | Consumer Food | Small Cap

Data adjusted to bonus, split, extra-ordinary income, rights issue and change in financial year end.
Value Creation Index Colour Code Guide ⓘ
| Mar'15 | Mar'16 | Mar'17 | Mar'18 | Mar'19 | Mar'20 | Mar'21 | Mar'22 | Mar'23 | Mar'24 | TTM | |
|---|---|---|---|---|---|---|---|---|---|---|---|
| ROCE % ⓘ | 32.7% | 26.4% | 23.5% | 23.3% | 7.1% | 5.3% | 3.9% | 6.4% | 5.8% | 5.1% | - |
| Value Creation Index ⓘ | 1.3 | 0.9 | 0.7 | 0.7 | -0.5 | -0.6 | -0.7 | -0.5 | -0.6 | -0.6 | - |
Growth Parameters ⓘGrowth Parameters Colour Code Guide ⓘ | |||||||||||
| Sales ⓘ | 431 | 397 | 431 | 513 | 843 | 1,767 | 1,867 | 2,009 | 2,255 | 2,328 | 2,559 |
| Sales YoY Gr. | - | -7.9% | 8.5% | 19.1% | 64.4% | 109.6% | 5.7% | 7.6% | 12.2% | 3.2% | - |
| Adj EPS ⓘ | 27.8 | 26.4 | 27.7 | 33.7 | 28.4 | 29.3 | 33.2 | 48.6 | 49.8 | 43.3 | 51.1 |
| YoY Gr. | - | -5% | 5.1% | 21.5% | -15.8% | 3.4% | 13.2% | 46.6% | 2.3% | -13.1% | - |
| BVPS (₹) ⓘ | 103.9 | 122.5 | 142.6 | 176.9 | 587.3 | 600.2 | 717.9 | 761.3 | 805.4 | 842.4 | 864.5 |
| Adj Net Profit ⓘ | 108 | 103 | 108 | 132 | 164 | 169 | 211 | 310 | 317 | 275 | 325 |
| Cash Flow from Ops. ⓘ | 69.2 | 89.9 | 77 | 69.1 | 149 | 259 | 287 | 237 | 91.7 | 246 | - |
| Debt/CF from Ops. ⓘ | 0 | 0 | 0.3 | 0.4 | 10.5 | 5.9 | 1.9 | 1.6 | 3.2 | 1.3 | - |
CAGR Colour Code Guide ⓘ
| 9 Years | 5 Years | 3 Years | 1 Years | |||||
|---|---|---|---|---|---|---|---|---|
| Sales ⓘ | 20.6% | 22.5% | 7.6% | 3.2% | ||||
| Adj EPS ⓘ | 5.1% | 8.8% | 9.2% | -13.1% | ||||
| BVPSⓘ | 26.2% | 7.5% | 5.5% | 4.6% | ||||
| Share Price | 6.1% | 5.3% | 1.1% | 5.7% | ||||
Performance Ratio Colour Code Guide ⓘ
| Mar'15 | Mar'16 | Mar'17 | Mar'18 | Mar'19 | Mar'20 | Mar'21 | Mar'22 | Mar'23 | Mar'24 | TTM | |
|---|---|---|---|---|---|---|---|---|---|---|---|
| Return on Equity % ⓘ | 29.7 | 23.3 | 20.9 | 21.1 | 8 | 4.9 | 5.3 | 6.6 | 6.4 | 5.3 | 6 |
| Op. Profit Mgn % ⓘ | 23.2 | 23 | 23.1 | 24.4 | 21.9 | 18.2 | 18.5 | 17.1 | 15 | 13.2 | 13.7 |
| Net Profit Mgn % ⓘ | 25.7 | 26.5 | 25.7 | 26.2 | 19.7 | 9.6 | 11.3 | 15.4 | 14 | 11.8 | 12.7 |
| Debt to Equity ⓘ | 0 | 0 | 0 | 0 | 0.5 | 0.4 | 0.1 | 0.1 | 0.1 | 0.1 | - |
| Working Cap Days ⓘ | 59 | 73 | 55 | 50 | 142 | 110 | 110 | 114 | 118 | 128 | 84 |
| Cash Conv. Cycle ⓘ | -35 | -50 | -51 | -45 | -67 | -45 | -34 | -9 | 24 | 39 | 40 |
| Standalone | Consolidated | |
|---|---|---|
| TTM EPS (₹) | 5.2 | 51.1 |
| TTM Sales (₹ Cr.) | 238 | 2,559 |
| BVPS (₹.) ⓘ | 633.3 | 864.5 |
| Reserves (₹ Cr.) ⓘ | 3,966 | 5,437 |
| P/BV ⓘ | 2.78 | 2.04 |
| PE ⓘ | 336.89 | 34.49 |
| From the Market | |
|---|---|
| 52 Week Low / High (₹) | 1493.00 / 2484.00 |
| All Time Low / High (₹) | 2.05 / 2484.00 |
| Market Cap (₹ Cr.) | 11,218 |
| Equity (₹ Cr.) | 63.6 |
| Face Value (₹) | 10 |
| Industry PE ⓘ | 62.1 |
| Mar'24 | YoY Gr. Rt. % | Jun'24 | YoY Gr. Rt. % | Sep'24 | YoY Gr. Rt. % | Dec'24 | YoY Gr. Rt. % | |
|---|---|---|---|---|---|---|---|---|
| Sales (₹ Cr.)ⓘ | 8.1 | 917.5 | 1.3 | N/A | 1.2 | 112.1 | 7.2 | 166.1 |
| Adj EPS (₹) ⓘ | 0.1 | 0 | -0.1 | N/A | 0 | -80 | 0.1 | N/A |
| Op. Profit Mgn % ⓘ | 0.76 | -715 bps | -24.81 | -2481 bps | -5.88 | -2058 bps | -0.07 | 225 bps |
| Net Profit Mgn % ⓘ | 0.67 | -264 bps | -5.85 | -585 bps | 2.29 | -1805 bps | 2.05 | 393 bps |
| Pledged * | 0.00 | 0.00 | 0.00 | 0.00 | 0.00 | 0.00 | 0.00 | 0.00 | 0.00 | 0.00 |
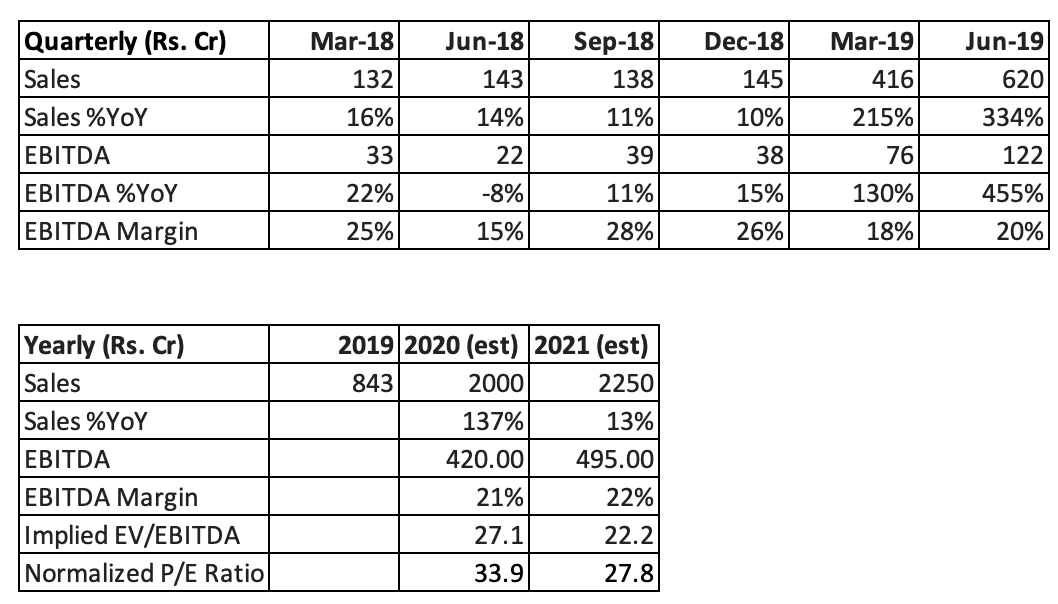
Results: Zydus Wellness Ltd. (Zydus) reported a year on year sales growth of 17% and operating profit growth of 38%.
Key highlights:
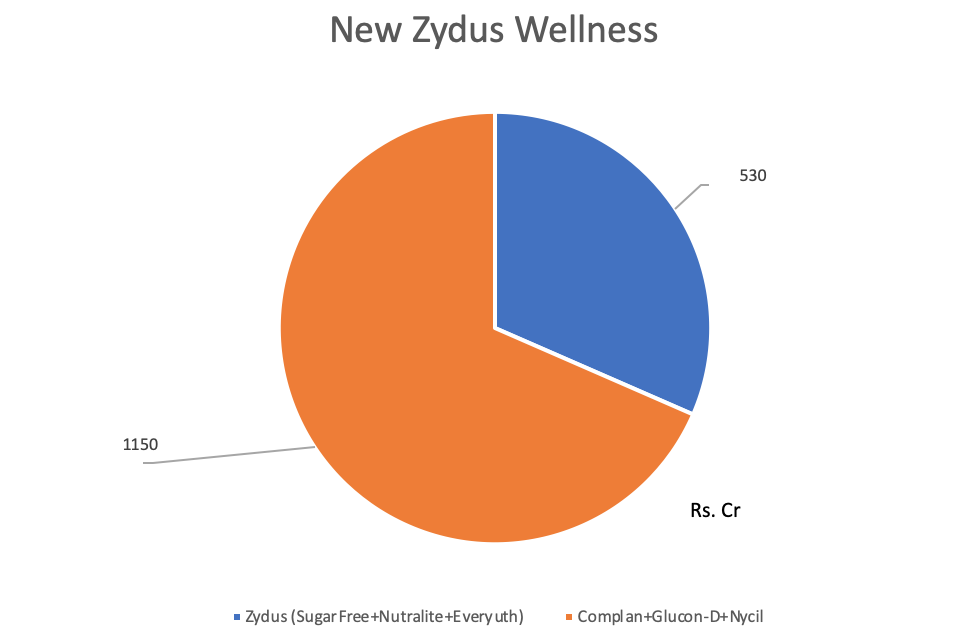
Outlook: After the acquisition of Heinz, Zydus now has five brands (Sugarfree, Everyuth, Glucon-D, Complan & Nycil) in different categories with strong customer recall value. The company is looking to double the direct distribution reach in general trade & further enhance its chemist channel. As of now the company is looking to save various costs by reducing duplication of costs after the integration with Heinz Business. Marketing expenditure, which is ~13% of sales, will come down in the near term. Zydus is looking to increase Complan volumes through the chemist channel. As per the management, the wholesale channel is slowly recovering. Tier 2, 3 cities are witnessing good traction. The company does not have much sales contribution from rural.
Zydus has a predominant presence in chemists and urban (both kirana and modern retail stores) whereas Heinz India has large presence in rural and groceries. Since both the companies have different supply chain model, they can use for each other’s distribution to cross their different products. We believe current traction in sales growth will last over few quarters as products will be pushed through new channels. Based on our estimate, Zydus is just marginally overvalued. If we see any weakness due to market sentiment, we would consider Zydus for purchase. For those who already own the stock, may continue to HOLD.
About the company
Zydus Wellness, subsidiary of Cadila Healthcare, is one of the leaders in Sugar Substitute in the country. The brand, SugarFree, is almost synonymous to sugar substitute for consumers.
Zydus also have other small products in bouquet like Everyuth, Nutralite. Recently Zydus Wellness acquired Heinz India portfolio. It includes Nycil, Complan, Glucon-D, etc. We believe this has improved growth prospects for Zydus.
MoneyWorks4me Opinion
We were of opinion that Zydus didn’t leverage its distribution enough versus other FMCG/Wellness products due to inadequate bargaining power with the distributors and retailers. Setting up distribution channel for a single product is not very efficient. Large number of brands gives an FMCG company more sales traction as it can push more brands to retailer/distributors along with their blockbuster products. For example: ITC has large demand for Cigarettes. It can push biscuits/atta/chips to retailer/distributor or else threaten them to stop supplying them blockbuster Cigarettes.

Now that Zydus has got large portfolio of products in its fold, it can utilize its existing channels for supplying more products as well as increase its own presence by leveraging Heinz’s supply chain. Not only that, even its SugarFree has got better competitive edge over competitors who sell "sugar substitutes" only.
Heinz India has large presence in rural and groceries versus Zydus predominant presence in chemists and modern/urban retail. Since both the companies have different supply chain model, they can use for each other’s products to scale up sales faster. We believe that current traction in sales will last over few quarters as products will be flushed through new channels.
We are very optimistic on Zydus’s prospects from long term point of view. Earlier we were sceptical about very bright prospects and assigned lower P/E multiple to Zydus due to i) single product ii) high cash balance iii) low bargaining power wrt distribution channel.
Concerns/Risks
Valuation
We were expecting sales traction to start after 4-6 quarters till supply chain restructuring happens. However, jump in sales volumes was a surprise. We expect that this momentum to sustain over few more quarters, post which it will have to invest in marketing to grow volumes.
Based on our estimate, Zydus Wellness is just marginally overvalued. If we see any weakness due to market sentiment, we would consider Zydus Wellness for purchase. For those who already own the stock, may continue to HOLD.
Positives:
Sugar Free
India is said to be the diabetic capital of world with around 5 crore people suffering with diabetes and the numbers is growing at an increasing rate. Artificial Sweeteners market in India is growing at ~5% a year and currently pegged at 300 crores. More than 50% of Zydus’ revenues come from Sugar Free. Our back of the envelope calculations suggest not more than 40-60 lakh people consume Sugar Free. This leaves decent scope for penetration of artificial sweetener category as a whole. As per the management interviews, 40% of people consuming sugar free comes from people who are not diabetics, but consume it for health reasons. Zydus Wellness has been spending decent amount on Advertisement and Sales but not something which we would like them to spend. Since the growth numbers are not linear, we understand that the advertisement spends vary from time to time. However, we are very happy with distribution of Sugar Free. The management is further expanding the same. Looking at global trends the company is introducing various brand extensions e.g. Sugar Free Green was launched as a sugar substitute manufactured from stevia leaves that are natural and ~200% times sweeter than sugar.
Everyuth / Nutralite
1.Everyuth is a comprehensive brand with three categories viz: 1. Face wash 2.Scrubs 3.Peels. Zydus has a good market share in 2nd and 3rd category with an intense competition from other brands.
2.Nutralite is a butter substitute (margarine). It has lesser cholesterol and lower amount of hydrogenated fats as compared to butter. Zydus is a category creator with this brand as it calls Nutralite ‘better than butter’ for health conscious people. But Nutralite is not gaining significant traction as of now.
With a market share across all categories and good brand equity, Zydus generates high ROE due to higher margins and lower investment requirement. We believe that this is likely to remain intact.
Concerns:
1. Mostly concerns are on growth side. Cash is getting accumulated on balance sheet and it has to be deployed in efficient manner. The management is exploring for new acquisitions of new brands in consumer health space. The growth could come from inorganic route. Till then we can’t factor in lot of growth into the future. We are not sure whether new venture would have almost similar ROE as existing business (54% pre-tax)
2. The lack of entry barriers is a risk as R&D is not a major prerequisite for manufacturing of artificial sweeteners. Since the market is in its nascent stage,as the demand increases, many more FMCG players or MNC counterparts may enter this segment. High dependence on one major revenue stream makes the business little vulnerable to competition. However, if the company keeps making advertisement expenditures, it could defend competition well.
Current share price factors in all the positives of the business. Besides, we also believe that current price also anticipates growth from inorganic route. We would be monitoring deals and value generated by acquisitions in the future. For those who hold the stock, considering selling the stock partially.
| Company Name | CMP(₹) | |||||||
|---|---|---|---|---|---|---|---|---|
| Hatsun Agro Product | 904 | 8.5 (0.9%) | Small Cap | 7,990 | 12.8 | 3.2 | 69.9 | 11.6 |
| LT Foods | 346.5 | -5.9 (-1.7%) | Small Cap | 7,772 | 17.1 | 7.7 | 20.6 | 3.2 |
| KRBL | 310.6 | 2.2 (0.7%) | Small Cap | 5,385 | 19 | 10.9 | 16.2 | 1.4 |
| Avanti Feeds | 870.7 | -19.6 (-2.2%) | Small Cap | 5,369 | 35.3 | 7.2 | 25.2 | 4.6 |
| HMA Agro Indus | 32.2 | -2.1 (-6.1%) | Small Cap | 4,665 | 1 | 2.1 | 35.8 | 2.2 |
| Heritage Foods | 390.5 | -11.4 (-2.8%) | Small Cap | 3,734 | 18.4 | 2.6 | 21.8 | 4 |
| Parag Milk Foods | 179.7 | -3 (-1.6%) | Small Cap | 3,139 | 8.6 | 2.6 | 21.3 | 2.2 |
| Devyani Internatl. | 178.6 | 1.5 (0.9%) | Small Cap | 2,998 | 0.2 | 9.2 | 963.5 | 18.4 |
| Dodla Dairy | 1,036 | -52.1 (-4.8%) | Small Cap | 2,907 | 37.8 | 5.3 | 28.8 | 5.3 |
| Sapphire Foods India | 316.4 | -4 (-1.3%) | Small Cap | 2,594 | 0.6 | 2 | 518.7 | 7.5 |
| PARTICULARS | Mar'15 | Mar'16 | Mar'17 | Mar'18 | Mar'19 | Mar'20 | Mar'21 | Mar'22 | Mar'23 | Mar'24 |
|---|---|---|---|---|---|---|---|---|---|---|
| Sales | 431 | 397 | 431 | 513 | 843 | 1,767 | 1,867 | 2,009 | 2,255 | 2,328 |
| Operating Expenses ⓘ | 331 | 305 | 332 | 387 | 658 | 1,446 | 1,522 | 1,667 | 1,918 | 2,020 |
| Manufacturing Costs | 55 | 54 | 56 | 66 | 108 | 103 | 102 | 78 | 98 | 104 |
| Material Costs | 83 | 81 | 92 | 113 | 216 | 779 | 845 | 980 | 1,146 | 1,138 |
| Employee Cost | 34 | 39 | 45 | 54 | 82 | 152 | 159 | 159 | 162 | 186 |
| Other Costs ⓘ | 158 | 131 | 138 | 154 | 252 | 411 | 416 | 450 | 512 | 591 |
| Operating Profit ⓘ | 100 | 91 | 99 | 125 | 185 | 321 | 344 | 342 | 337 | 308 |
| Operating Profit Margin (%) | 23.2% | 23.0% | 23.0% | 24.4% | 21.9% | 18.2% | 18.4% | 17.0% | 15.0% | 13.2% |
| Other Income ⓘ | 28 | 32 | 33 | 35 | 39 | 11 | 9 | 13 | 5 | 14 |
| Interest ⓘ | 0 | 0 | 1 | 2 | 30 | 140 | 84 | 26 | 16 | 24 |
| Depreciation ⓘ | 8 | 7 | 7 | 9 | 13 | 26 | 25 | 24 | 25 | 24 |
| Exceptional Items ⓘ | 0 | 0 | 0 | 0 | -10 | -44 | -132 | 0 | -10 | -14 |
| Profit Before Tax ⓘ | 120 | 117 | 124 | 150 | 171 | 121 | 112 | 306 | 291 | 260 |
| Tax ⓘ | 9 | 12 | 13 | 13 | -1 | -20 | -7 | -3 | -20 | -7 |
| Profit After Tax | 111 | 105 | 111 | 137 | 171 | 142 | 119 | 309 | 310 | 267 |
| PAT Margin (%) | 25.8% | 26.5% | 25.8% | 26.6% | 20.3% | 8.0% | 6.4% | 15.4% | 13.8% | 11.5% |
| Adjusted EPS (₹) | 27.9 | 26.4 | 27.9 | 34.3 | 29.3 | 24.6 | 18.7 | 48.5 | 48.8 | 42.0 |
| Dividend Payout Ratio (%) | 22% | 25% | 23% | 23% | 17% | 20% | 27% | 10% | 10% | 12% |
| PARTICULARS | Mar'15 | Mar'16 | Mar'17 | Mar'18 | Mar'19 | Mar'20 | Mar'21 | Mar'22 | Mar'23 | Mar'24 |
|---|---|---|---|---|---|---|---|---|---|---|
Equity and Liabilities | ||||||||||
| Shareholders Fund | 406 | 479 | 557 | 691 | 3,386 | 3,461 | 4,568 | 4,844 | 5,123 | 5,358 |
| Share Capital ⓘ | 39 | 39 | 39 | 39 | 58 | 58 | 64 | 64 | 64 | 64 |
| Reserves ⓘ | 367 | 439 | 518 | 652 | 3,329 | 3,403 | 4,504 | 4,780 | 5,059 | 5,294 |
| Minority Interest | 7 | 9 | 11 | 13 | 0 | 0 | 0 | 0 | 0 | 0 |
| Debt | 0 | 0 | 25 | 25 | 1,569 | 1,519 | 550 | 132 | 230 | 324 |
| Long Term Debt | 0 | 0 | 0 | 0 | 1,500 | 1,500 | 313 | 63 | 0 | 0 |
| Short Term Debt | 0 | 0 | 25 | 25 | 69 | 19 | 237 | 69 | 230 | 324 |
| Trade Payables | 50 | 63 | 67 | 79 | 392 | 504 | 439 | 364 | 313 | 363 |
| Others Liabilities ⓘ | 45 | 17 | -33 | -53 | 8 | -15 | -16 | 311 | 18 | -52 |
| Total Liabilities ⓘ | 508 | 568 | 626 | 755 | 5,356 | 5,469 | 5,540 | 5,651 | 5,684 | 5,992 |
Fixed Assets | ||||||||||
| Gross Block | 113 | 117 | 144 | 154 | 4,712 | 4,844 | 4,858 | 4,919 | 4,961 | 4,934 |
| Accumulated Depreciation | 28 | 35 | 42 | 51 | 144 | 170 | 190 | 209 | 228 | 226 |
| Net Fixed Assetsⓘ | 84 | 82 | 103 | 104 | 4,567 | 4,674 | 4,667 | 4,710 | 4,732 | 4,708 |
| CWIP ⓘ | 0 | 0 | 0 | 0 | 10 | 4 | 4 | 12 | 13 | 10 |
| Investmentsⓘ | 0 | 94 | 30 | 148 | 46 | 110 | 0 | 27 | 70 | 78 |
| Inventories | 26 | 24 | 32 | 35 | 233 | 292 | 365 | 362 | 458 | 468 |
| Trade Receivables | 1 | 3 | 4 | 9 | 96 | 118 | 94 | 142 | 208 | 283 |
| Cash Equivalents | 339 | 305 | 440 | 414 | 164 | 82 | 253 | 170 | 38 | 240 |
| Others Assetsⓘ | 57 | 60 | 17 | 46 | 238 | 188 | 157 | 228 | 165 | 207 |
| Total Assets ⓘ | 508 | 568 | 626 | 755 | 5,356 | 5,469 | 5,540 | 5,651 | 5,684 | 5,992 |
| PARTICULARS | Mar'15 | Mar'16 | Mar'17 | Mar'18 | Mar'19 | Mar'20 | Mar'21 | Mar'22 | Mar'23 | Mar'24 |
|---|---|---|---|---|---|---|---|---|---|---|
| Cash Flow From Operating Activity ⓘ | 69 | 90 | 77 | 69 | 149 | 259 | 287 | 237 | 92 | 246 |
| PBT ⓘ | 120 | 117 | 124 | 150 | 171 | 121 | 112 | 306 | 291 | 260 |
| Adjustment ⓘ | -19 | -25 | -23 | -21 | -8 | 163 | 240 | 41 | 42 | 33 |
| Changes in Working Capital ⓘ | -21 | 12 | -15 | -48 | 49 | -23 | -66 | -106 | -240 | -44 |
| Tax Paid ⓘ | -11 | -14 | -9 | -12 | -63 | -2 | 0 | -4 | -1 | -3 |
| Cash Flow From Investing Activity ⓘ | 29 | -28 | -72 | -59 | -4,162 | -17 | -10 | -86 | -85 | -19 |
| Capex | 3 | -4 | -31 | -8 | -17 | -25 | -17 | -75 | -44 | -26 |
| Net Investments | 0 | -55 | -73 | -83 | 460 | -3 | 0 | -21 | -41 | -5 |
| Others ⓘ | 27 | 31 | 31 | 32 | -4,604 | 11 | 7 | 9 | 1 | 12 |
| Cash Flow From Financing Activityⓘ | -27 | -58 | -6 | -2 | 4,052 | -260 | -216 | -234 | -139 | -26 |
| Net Proceeds from Shares ⓘ | 0 | 0 | 0 | 0 | 2,575 | 0 | 987 | 0 | 0 | 0 |
| Net Proceeds from Borrowing ⓘ | 0 | 0 | 0 | 0 | 1,500 | 0 | -1,320 | -188 | -250 | -63 |
| Interest Paid ⓘ | 0 | 0 | -1 | 0 | -30 | -140 | -101 | -32 | -16 | -24 |
| Dividend Paid ⓘ | -23 | -48 | -25 | -2 | -31 | -58 | 0 | -32 | -32 | -32 |
| Others ⓘ | -4 | -10 | 20 | 0 | 38 | -62 | 218 | 18 | 159 | 92 |
| Net Cash Flow ⓘ | 71 | 4 | -1 | 8 | 39 | -18 | 60 | -83 | -132 | 201 |
| PARTICULARS | Mar'15 | Mar'16 | Mar'17 | Mar'18 | Mar'19 | Mar'20 | Mar'21 | Mar'22 | Mar'23 | Mar'24 |
|---|---|---|---|---|---|---|---|---|---|---|
| Ratios | ||||||||||
| ROE (%) | 30.39 | 23.79 | 21.49 | 21.87 | 8.4 | 4.14 | 2.96 | 6.56 | 6.23 | 5.09 |
| ROCE (%) | 32.74 | 26.44 | 23.48 | 23.33 | 7.08 | 5.26 | 3.88 | 6.41 | 5.77 | 5.12 |
| Asset Turnover Ratio | 0.97 | 0.79 | 0.77 | 0.75 | 0.28 | 0.36 | 0.37 | 0.38 | 0.43 | 0.43 |
| PAT to CFO Conversion(x) | 0.62 | 0.86 | 0.69 | 0.5 | 0.87 | 1.82 | 2.41 | 0.77 | 0.3 | 0.92 |
| Working Capital Days | ||||||||||
| Receivable Days | 2 | 2 | 3 | 4 | 23 | 20 | 19 | 20 | 26 | 36 |
| Inventory Days | 22 | 21 | 22 | 23 | 58 | 50 | 60 | 62 | 62 | 68 |
| Payable Days | 219 | 256 | 257 | 235 | 397 | 210 | 204 | 149 | 108 | 108 |
Zydus Wellness Ltd. is established in 1988. The company is a leading consumer wellness company with an Indian heritage and a global footprint. It believes, a healthy lifestyle is not just about being active but also about feeling good from within. So, it approaches health and wellness in a holistic manner. It nourishes, nurture and energize millions of lives by offering a variety of innovative, industry-leading products. With several years of operational excellence, it has seven leading brands in its portfolio, namely Complan, Sugar Free, Glucon-D, Everyuth, Nycil, Sugarlite and Nutralite.
Headquartered in Ahmedabad and Mumbai, it has many manufacturing facilities across several locations - Aligarh, Sitarganj. Ahmedabad and Sikkim. It also has 8 co-packing facilities in India, Oman and Newzealand. Its core pillars -manufacturing integrity, supply chain efficiency, and product innovation, form the basis of the legacy it has built over the last few decades. Currently the Zydus Wellness business spans over several countries and many continents. It combines the best of healthcare, nutrition and cosmeceutical products to provide quality wellness products. It helps people pursue integrated well-being through its widening range of products.
Business area of the company
The company is an integrated consumer company. The Company is engaged in the development, production, marketing and distribution of health and wellness products.
Product of the Company
The Company has a wide range of health and wellness products. The Company’s product portfolio includes popular brands with functional benefits like Glucon D, Complan, Sugar Free, Nycil, Everyuth, Nutralite and Sugarlite.
Awards
2017-18
2018-19
2019-20
Milestones

MoneyWorks4Me rating and ranking of funds for SIP is available to subscribers only. Moneyworks4Me is not a rating and ranking agency, however it is required that users have a way of selecting funds and building a Portfolio. The method used by it are described below to enable users to understand the logic behind the rating and ranking Subscriber will find more details on this in the various content made available from time to time. In case you need more please write to besafe@moneyworks4Me.com
MoneyWorks4Me rates and ranks mutual funds based on the following data-driven system:
Funds ranking in screeners: Performance Consistency and Quality are two parameters used for ranking funds for SIP. The ranking as follows GG, GO, GR, OG, OO, OR, RG, RO and RR.
With the same color-coded funds, the one with the higher Average 3-year rolling returns (over 5 to 10 years), the number that appears in the Performance tag, ranks higher.
Here is the summary:
The third tag Upside Potential is not relevant for SIP. It is relevant for lumpsum investments in Mutual Funds.

Make an informed decision for Stocks
Invest using an intelligent system with powerful data-driven tools that help you identify opportunities and make informed buy-hold-sell decisions
Buy quality Stocks when they are available at reasonable prices and supported by an upward price trend and Sell when they are Overvalued using the Decizen Rating System. Covers 3500+ stocks

Account Discovery
- OTP from CAMS
Account Linking for Stocks & MF
- One OTP per link Eg. NSDL, CDSL, CAMS, KFin etc.
One Click Upload for your Current Portfolio and Future Transactions!

 Download APP


