Finding financially strong companies to invest in is the first step to make your money work for you in the stock market. But this is a mind numbing task for most of us who fear financial statements, annual reports, spreadsheets or anything to do with numbers for that matter. To address this problem MoneyWorks4me came up with a unique solution – 10 YEAR X-RAY a simple and powerful visual tool that helps you identify the strong stocks and weed out the weaker ones in a few seconds. We have colour coded the 10 YEAR X-RAY based on the growth rates for ten years, which can help you access the company’s financial health within no time.
Now, with the recent upgrade of MoneyWork4me we have expanded the 10 YEAR X-RAY to 10 YEAR X-RAY Pro. This new and improved version acts like a magnifying glass helping you narrow down upon the best of the best companies to invest in. Now, in a single snap shot you can understand the business performance of the company as well as the efficiency of its financial management (through Key Financial Ratios.) But before we go on to explain this revamped version, let’s recap a little….
In our earlier article on 10 YEAR X-RAY (Stock Shastra #3) we talked about how in order to judge the historical financial performance of any company we need to check its performance based on 5 most important parameters. These are
- EPS (Earnings per share): Y-o-Y figures analysed to judge the profitability and its growth
- Growth in net sales : Y-o-Y figures analysed to judge growth in demand
- Book value per share : Y-o-Y figures analysed to judge reinvestment of profits into the business
- Return on invested capital (ROIC): analysed to judge efficiency of management of finance.
- Debt to net profit: analysed to judge the degree to which company is leveraged
So, what has changed?
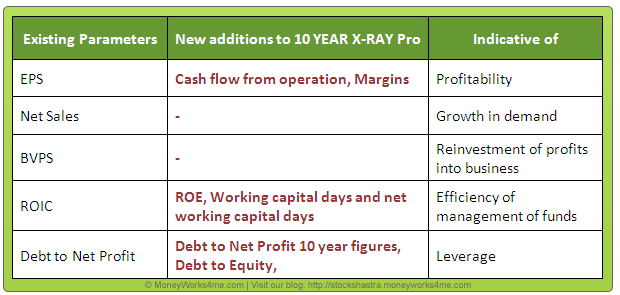
In order to strengthen our judgement and to arrive at more comprehensive and stringent conclusions, we have added some new parameters to support the existing 5 important financial parameters. These new additions are:

For those of you who want a detailed understanding on 10 YEAR X-RAY , read our earlier article on it .
So, let’s explain the new additions in 10 YEAR X-RAY PRO
1) Cash Flow from Operations (CFO): It is said ‘Cash is King’ and our newest parameter indicates exactly that i.e. Cash generated by a company from its core operations. We look at the profitability of a company through EPS and its growth. However, a company can generate good earnings and yet face difficulties in running day-to-day operations and repay its debt, if the CFO is not good. So, this parameter becomes very critical to look at. CFO can also be used as a check on the quality of a company’s earnings. High profits, but below average CFO could be an indicator of aggressive accounting techniques.
2) Debt-to-Net Profit ratio for 10 years: Debt-to-Net Profit ratio gives us the number of years a company will take to repay its debt at the current levels of Net Profit. The 10 YEAR X-RAY PRO now gives you this figure for a company for the last 10 years (the earlier version gave only the latest ratio). So, if a company has historically shown a tendency to be highly leveraged or has shown an increasing level of debt, it could point to signs of trouble.
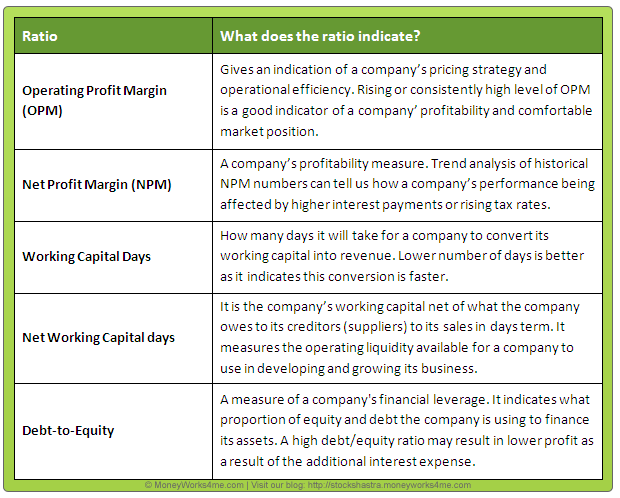
3) Other key financial ratios: While the 6 parameters can give you a very good idea about the financial strength of a company, we still wanted to be extra-sure. For example: a company can post higher sales and profit figures by manipulating (increasing) it’s receivables in the market. Thus to get rid of such manipulative companies and to find out the true performers we decided to add some of the key efficiency ratios of a company. These ratios are:

If you want to read in detail about these, view the help section. These financial ratios look into different aspects like profitability, efficiency of day-to-day operations; leverage used by the company and further helps us to weed out the average or below average performers. The end result – We are left with the best, fundamentally strong, Green companies.
What’s more is that now, you can view the 10 YEAR X-RAY (i.e. the 6 most critical financial parameters) for any company of your choice from the BSE 500 list ABSOLUTELY FREE!
All you need to do is register on MoneyWorks4me.com to start. So, go ahead and do check the 10 YEAR X-RAY of the stocks in your portfolio!


congrats.this improvement will help greatly. I have a suggestion. Along with thde 10 year xray, if u could include price movements (discounted for splits, bonus etc.) with the eps. This will give us the idea when the share was overpriced or underpriced also at which P/E level. For example, during 08-09, the price of a stock was much higher then what they were in 01-02 in spite of a collapse of the market. That will allow us to decide whether what we are buying is a real value and whether it should be kept for real long term.
dinesh shah