What is Nifty @ MRP?
As investors, we constantly track the Nifty movements. To make investing more profitable and not a game of mere chance, we need a solution, a solution which could help us to identify whether the market is over-reacting or under-reacting, whether it is grossly depressed or irrationally exuberant. This is exactly what Nifty @ MRP is!
Considering that the Nifty stocks are the top traded stocks of the country, we expect them to be traded at their MRPs (fair value). But in reality, the stocks are driven by their earnings over the long term. Hence, it is said that the market is a slave of the corporate earnings. Thus, Nifty @ MRP gives an indication of whether the Nifty is fairly valued or whether irrationality is driving the markets.
What is the latest value of Nifty @ MRP?
Considering the free float market capitalization at the MRP of individual stocks and considering the share price data as of 27th August, the Nifty@MRP comes out to 6459. On 27th August, NSE Nifty index closed at 5287, which is 18% or 1172 points below the Nifty@MRP of 6459. It indicates that the index is highly undervalued currently. If all the Nifty stocks were trading at the discounted price; then the Nifty would be at 4486, a whopping 30% discount.
On similar lines, the Sensex@MRP comes out to 21145. On 27th August, the Sensex .png) closed at 17968, which is about 18% or 3177 points below Sensex@MRP of 21145.
closed at 17968, which is about 18% or 3177 points below Sensex@MRP of 21145.
So, considering June-13 quarter financial performance, we can say that the broader market indices are currently under-valued by ~18%.
Analysis of the March 13 financial performance of Nifty 50 companies
Quarterly performance
For the first quarter of FY 2013-14, the cumulative sales of the Nifty 50 companies has grown 4% year on year. However, the EBITDA and PAT have increased by a healthy 15% and 22.5%, respectively.
Annual performance
For the financial year 2012-13, the cumulative sales for the Nifty 50 companies grew by 15.3%. The EBITDA and PAT for the same increased by 13% and 9%, respectively.
The economic environment had a negative impact on the Nifty companies. Capital intensive sectors like construction, capital goods and metals continued to report weak performances. Order inflow for capital goods companies has been low and the cyclical industries have been impacted by slow economic activity. Along with this, the automobile industry has suffered its worst slowdown in last decade with sales of passenger cars and commercial vehicles falling consistently. The power industry continued to grapple with fuel shortage concerns.
Compared to these, the defensive sectors like FMCG and Pharma have performed well along with IT. IT companies have benefited from the weakness in Indian National Rupee and improving US economy. However, in coming months; the immigration bill, which is going to be presented in the US senate in September, will hold the key for the companies getting major revenues from US. The public sector banks have disappointed again with rising non performing assets (NPAs), though, the private banks have performed well.
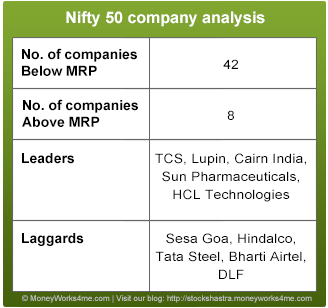
With respect to financial performance, the leaders and laggards from the Nifty 50 companies reflect the current trend. Leaders include companies like TCS, Sun Pharmaceuticals, Lupin, Cairn India and HCL Technologies. On the other hand, Laggards include capital intensive companies like Sesa Goa, DLF, Hindalco, Tata Steel and Bharti Airtel.
Over all, out of 50 Nifty companies, around 8 companies are trading above their MRP (Over-valued), 12 companies are trading below their DP (Under-valued) and rest 30 companies are between DP and MRP.
Future outlook
The Indian stock market has shown extreme volatility, witnessing some of the historical low levels in past 3 months. Falling GDP growth, rising inflation, rupee depreciation and widening current account deficit, all mirror the uncertainty prevalent in the market. These factors have contributed to the current battered state of the Indian stock market and the economy. Contraction in exports, inflation above 7% and rupee fall has weakened the confidence of investors, who are rushing to gold as a hedge against inflation. This, in turn, is increasing the demand of gold which is widening the already huge current account deficit. Rising deficit has resulted in further depreciation of rupee making imports costlier, specially the crude oil imports, consequently leading to high inflation. Rising CAD, on account of rising gold and oil imports, marred the prospects of lowering of interest rates, instrumental to spur growth. Manufacturing and mining sectors performed relatively poor in FY 12-13; that coupled with rupee depreciation led to a decade low GDP growth of 5% only in FY 12-13. Despite slowdown in domestic demand, manufacturing costs remained high on account of rupee depreciation. The above mentioned factors, which have crippled the economy, have not appeared all of a sudden; rather they are the outcome of policy inaction, infrastructure bottlenecks, red tape bureaucracy and socialist measures that cannot be supported by the current economy.
In response to the rising CAD, RBI increased the import duty on gold from 2% in Jan 2013, to 10% in Jun 2013. It also saw the gradual increment of diesel prices, which, however, proved insufficient by the steep fall, which rupee has faced in recent times. Amongst all the gloom prevailing, good monsoon in FY 13 comes as a soothing relief, which will boost agricultural production and aid in keeping food inflation low, consequently leading to relatively better GDP growth. More recently the Food security bill was passed in the Lok Sabha. This bill plans to ensure the supply of food grains at subsidized rates to about 67% of the total population. The cost of this bill is going to be Rs. 1.25 lac Cr. to the Government. As the Government already spends Rs. 90,000 Cr. on PDS system, the additional burden of Rs. 35,000 Cr. will impact the already bloated fiscal deficit. The Government is taking measures to manage it (fiscal deficit) by going for a big disinvestment program and a number of other measures like clearing major infrastructural projects as well, to restart the investment environment. If the fiscal deficit is not contained, it may lead to a possible ratings downgrade, eventually increasing the Government bond yields to high levels. Mr. Raghuram Rajan, in his papers, has suggested tough decision making, and as he begins his term as the governor of RBI on Sep 5th, 2013, it is to be seen what steps and measures are taken to revive the economy. However without Government coming into action, there is only so much that RBI can do.
On the global front, the US Federal bank announced that, if the economic environment in the United states continues to improve (based on better job data and improving housing sales), it will start tapering off the bond buying program in which it currently buys about $ 85 Billion every month, by the end of calendar year 2013. This announcement has had a strong impact on the debt and equity markets worldwide in the short term. In the long term, though, QE tapering will not have a major impact on the markets.
In India, in spite of high interest rates, the FII’s have started vacating their investments, post this announcement, at an alarming rate. This is because, the weak economic environment in India along with high Government deficits and slowing GDP growth may lead to a possible ratings downgrade and this scares the foreign investors. Alongside this, the improving picture of USA brings a much better opportunity for them. As the prospect of growth in Indian markets becomes riskier, funds are being pulled out at an alarming rate.
In Europe, though marginal GDP growth has emerged, the basic situation is more or less the same. The rates of unemployment in troubled European economies still remain horrifically high with Greece at 27%, Spain at 26% and Ireland at 13.5% unemployment. The Quantitative easing (QE) tightening has caused the bond yields to spike up worldwide. This will result into rise in cost of borrowing for the European countries which are already heavily burdened by debt.
Looking at the annual financial performance of Nifty 50 companies and future outlook, Nifty is quoting around 18% discount to Nifty@MRP. Considering the large, 18% discount and future growth potential of the Indian economy, we believe that the Indian stock market still provides good growth opportunity for long term investors. Currently, there are few fundamentally sound companies which are currently available at a hefty discount from their MRP with limited downside risk. Hence, you, as investors, should remain cautious in this volatile market while at the same time keep an eye on some bargain buys as indicated by our decision maker.
Considering the situation, investors would be best advised to buy fundamentally strong large companies at the right time and at the right price.
If you liked what you read and would like to put it in to practice Register at MoneyWorks4me.com. You will get amazing FREE features that will enable you to invest in Stocks and Mutual Funds the right way.
Need help on Investing? And more….Puchho Befikar
Kyunki yeh paise ka mamala hai
Start Chat | Request a Callback | Call 020 6725 8333 | WhatsApp 8055769463


.png)


American market too heading for prolonged bearish trend – [look at 10 year x-ray]