In our last article about the new features on our revamped site MoneyWorks4me.com, we talked about the 10 YEAR X-RAY PRO. We told you how now you can understand not only the business performance of the company but also its efficiency of financial management (through Key Financial Ratios) in a single snap shot.
So, let’s take a small test. Given below is the screenshot of the 10 YEAR X-RAY of a company. Click to see the X-RAY.
So, what’s your take on the financial performance of this company?
Is it
a) Green (Very Good) b) Orange (Somewhat Good) or c) Red (Not Good) ?
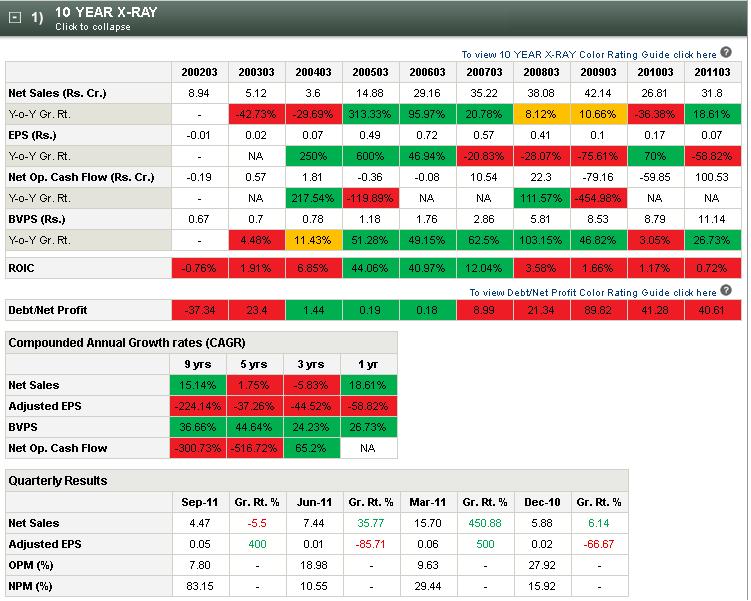
Well, the company given above seems to be doing badly on most of the parameters. The biggest concern: Very high Debt to Net Profit ratios for the last 5 years. A clear sign to stay away!
The verdict: It’s as RED as red can get!
Now, let’s take a look at another company.
So, what’s your conclusion now? Green, Orange or Red.
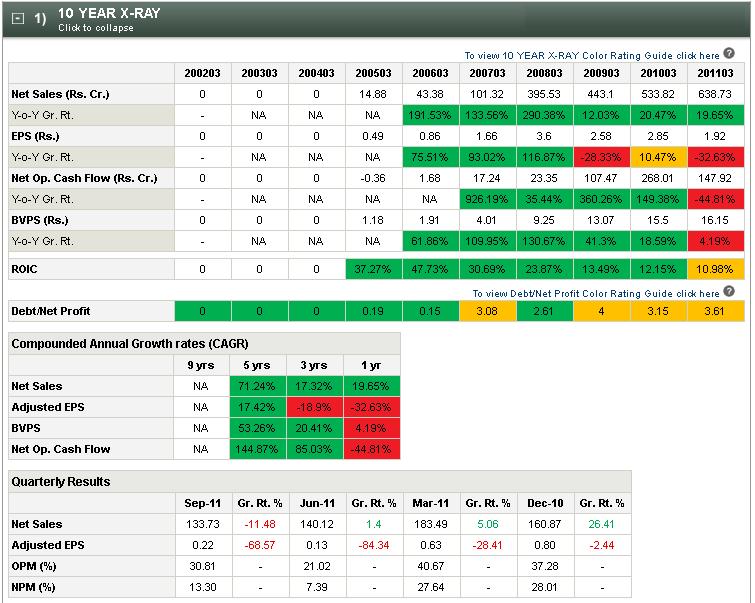
Well, for starters, the performance of this company is definitely much much better than the previous one and its numbers are way better from the numbers seen in the previous company.
I am sure all of us will agree that the company’s performance can atleast be classified as Orange (Somewhat Good). Right?
But wait, here comes the googly.
What if I told you that both these 10 YEAR X-RAYs belong to the SAME COMPANY!!
Surprised?! Don’t be! Many people feel that financial statements are confusing. And this is especially true if you are looking at 2 sets of them – like the above situation. Wondering how a company can have 2 sets of financial numbers? The answer is because of Standalone and Consolidated operations.
So, what are Standalone and Consolidated numbers?
The need for 2 sets of financials arises because of a company’s subsidiaries. A subsidiary is a separate company altogether which is partly or completely owned and wholly controlled by the parent company. Take for e.g. Tata Motors. Tata Motors has its operations spread all over the world and while it carries out the domestic operations through itself, for other locations it operates through subsidiaries. So, while Tata Motors is the parent company, Land Rover (a UK based car manufacturer) which is owned by Tata Motors is its subsidiary.
Standalone financials, as the name indicates, are the financial results of the parent company alone.
Consolidated financials, then, are the financial results of the parent company and the subsidiaries put together.
In the test you took, the first 10 YEAR X-RAY was on a standalone basis while the second was on a consolidated basis.
So, which numbers should you look at?
There is some debate over which numbers you should look at – Standalone or consolidated. One of the strongest arguments in favour of consolidated results is that it presents the financials of a company and its subsidiaries as a single economic unit. Thus, investors can find out the health of not only the standalone entity but also its subsidiaries.
However, analysing consolidated numbers is not as easy as analysing standalone numbers. Firstly a parent company can have differing ownership interests leading to creation of entities like a subsidiary, associate companies etc. Further, it can adopt different methods to consolidate or combine the numbers of these entities which can lead to lot of confusion when trying to analyse the financial performance.
While, both sides have pros and cons, the best way would be to look at the standalone numbers of the parent company and its subsidiaries and assess their financial performance individually. However, this is not easy to do as companies do not always publish the financial statements of the subsidiaries. The next best thing, then is to look at both numbers to correctly assess the financial performance of the company. Many times while standalone numbers might reflect good financial performance, the situation on the consolidated front might not be so rosy. More so in the current times, with the global economy under pressure, companies with subsidiaries in European countries could be going through tough times. To summarise, you cannot ignore the performance of the subsidiaries and hence it is important to look at consolidated numbers.
Where can you get both standalone and consolidated numbers?
Simple – At MoneyWorks4me.com, in order to help you get a complete understanding of the financial performance of a company we at MoneyWorks4me have introduced both Standalone and Consolidated versions of the 10 YEAR X-RAY of companies on our new site. Further, the MoneyWorks4me colour coding for a particular company is also given based on the assessment of the financial numbers which best reflect a company’s performance – either Standalone or Consolidated. This will help you avoid investing in a company which might appear good based on one set of numbers but might be losing money on the other.
In times like now, it is better to be safe than sorry, so the best way to shortlist a company for investing is by looking at its financial performance i.e. 10 YEAR X-RAY on both fronts i.e. Standalone and Consolidated. And MoneyWorks4me helps you do exactly this.
Now, that you know the importance of standalone and consolidated financials, go ahead and check whether the companies in your portfolio are champions on one side but duds on the other!
If you liked what you read and would like to put it in to practice Register at MoneyWorks4me.com. You will get amazing FREE features that will enable you to invest in Stocks and Mutual Funds the right way.
Need help on Investing? And more….Puchho Befikar
Kyunki yeh paise ka mamala hai
Start Chat | Request a Callback | Call 020 6725 833 | WhatsApp 8055769463


Great article, excellent flow and well presented.