

Invest in the best stock opportunities right now and every-time.
Start Systematic Stock Investing ...in less than a minute.

BSE: 532514 | NSE: IGL | Gas Transmission/Marketing | Mid Cap


Past 10 year's financial track record analysis by Moneyworks4me indicates that Indraprastha Gas Ltd is a good quality company.
The key valuation ratios of Indraprastha Gas Ltd's currently when compared to its past seem to suggest it is in the Undervalued zone.
The Price Trend analysis by MoneyWorks4Me indicates it is Weak which suggest that the price of Indraprastha Gas Ltd is likely to Fall in the short term. However, please check the rating on Quality and Valuation before investing.
Data adjusted to bonus, split, extra-ordinary income, rights issue and change in financial year end.
Value Creation Index Colour Code Guide ⓘ
| Mar'15 | Mar'16 | Mar'17 | Mar'18 | Mar'19 | Mar'20 | Mar'21 | Mar'22 | Mar'23 | Mar'24 | TTM | |
|---|---|---|---|---|---|---|---|---|---|---|---|
| ROCE % ⓘ | 31.4% | 27.4% | 31.9% | 32.3% | 31.7% | 31.2% | 24.8% | 28% | 27.9% | 29.9% | - |
| Value Creation Index ⓘ | 1.2 | 1.0 | 1.4 | 1.9 | 1.8 | 1.8 | 1.2 | 1.5 | 1.5 | 1.7 | - |
Growth Parameters ⓘGrowth Parameters Colour Code Guide ⓘ | |||||||||||
| Sales ⓘ | 3,681 | 3,686 | 3,815 | 4,535 | 5,765 | 6,485 | 4,941 | 7,710 | 14,133 | 14,000 | 16,090 |
| Sales YoY Gr. | - | 0.1% | 3.5% | 18.9% | 27.1% | 12.5% | -23.8% | 56.1% | 83.3% | -0.9% | - |
| Adj EPS ⓘ | 3.1 | 3 | 4.1 | 4.8 | 5.6 | 8.1 | 7.2 | 9.4 | 10.3 | 12.5 | 10.7 |
| YoY Gr. | - | -4.2% | 36% | 18.6% | 16.3% | 44.6% | -11.7% | 30.7% | 9.9% | 21.1% | - |
| BVPS (₹) ⓘ | 15 | 18 | 20.9 | 25.1 | 29.5 | 36.2 | 41.9 | 49.5 | 50.6 | 61.1 | 70.1 |
| Adj Net Profit ⓘ | 438 | 420 | 571 | 677 | 788 | 1,140 | 1,006 | 1,316 | 1,446 | 1,752 | 1,501 |
| Cash Flow from Ops. ⓘ | 664 | 653 | 946 | 879 | 1,157 | 1,361 | 1,546 | 1,898 | 2,231 | 1,536 | - |
| Debt/CF from Ops. ⓘ | 0.2 | 0 | 0 | 0 | 0 | 0 | 0 | 0 | 0 | 0 | - |
CAGR Colour Code Guide ⓘ
| 9 Years | 5 Years | 3 Years | 1 Years | |||||
|---|---|---|---|---|---|---|---|---|
| Sales ⓘ | 16% | 19.4% | 41.5% | -0.9% | ||||
| Adj EPS ⓘ | 16.6% | 17.3% | 20.3% | 21.1% | ||||
| BVPSⓘ | 16.9% | 15.7% | 13.4% | 20.7% | ||||
| Share Price | 15.8% | -3% | 3% | -12.6% | ||||
Performance Ratio Colour Code Guide ⓘ
| Mar'15 | Mar'16 | Mar'17 | Mar'18 | Mar'19 | Mar'20 | Mar'21 | Mar'22 | Mar'23 | Mar'24 | TTM | |
|---|---|---|---|---|---|---|---|---|---|---|---|
| Return on Equity % ⓘ | 22.7 | 18.2 | 21 | 21 | 20.6 | 24.8 | 18.4 | 20.6 | 20.6 | 22.4 | 16.4 |
| Op. Profit Mgn % ⓘ | 21.7 | 21.2 | 25.4 | 25 | 22 | 23.7 | 30.3 | 24.6 | 14.5 | 17.1 | 12.5 |
| Net Profit Mgn % ⓘ | 11.9 | 11.4 | 15 | 14.9 | 13.7 | 17.6 | 20.4 | 17.1 | 10.2 | 12.5 | 9.3 |
| Debt to Equity ⓘ | 0.1 | 0 | 0 | 0 | 0 | 0 | 0 | 0 | 0 | 0 | - |
| Working Cap Days ⓘ | 65 | 48 | 31 | 27 | 24 | 21 | 29 | 26 | 30 | 43 | 51 |
| Cash Conv. Cycle ⓘ | 1 | 5 | -4 | -14 | -12 | -8 | -16 | -19 | -8 | -6 | 4 |
Sales growth is growing at healthy rate in last 3 years 41.51%
Net Profit is growing at healthy rate in last 3 years 20.28%
Return on Equity has declined versus last 3 years average to 16.30%
Sales growth is not so good in last 4 quarters at 3.44%
| Standalone | Consolidated | |
|---|---|---|
| TTM EPS (₹) | 10.7 | 12.1 |
| TTM Sales (₹ Cr.) | 16,090 | 16,090 |
| BVPS (₹.) ⓘ | 70.1 | 78.2 |
| Reserves (₹ Cr.) ⓘ | 9,529 | 10,671 |
| P/BV ⓘ | 2.70 | 2.42 |
| PE ⓘ | 17.67 | 15.64 |
| From the Market | |
|---|---|
| 52 Week Low / High (₹) | 153.25 / 285.30 |
| All Time Low / High (₹) | 5.57 / 302.00 |
| Market Cap (₹ Cr.) | 26,530 |
| Equity (₹ Cr.) | 280 |
| Face Value (₹) | 2 |
| Industry PE ⓘ | 25.7 |
| Mar'24 | YoY Gr. Rt. % | Jun'24 | YoY Gr. Rt. % | Sep'24 | YoY Gr. Rt. % | Dec'24 | YoY Gr. Rt. % | |
|---|---|---|---|---|---|---|---|---|
| Sales (₹ Cr.)ⓘ | 3,964 | -2.3 | 3,891 | 3.5 | 4,088 | 7 | 4,146 | 5.6 |
| Adj EPS (₹) ⓘ | 5.5 | 16.1 | 5.7 | -8.3 | 6.2 | -19.4 | 2 | -27.1 |
| Op. Profit Mgn % ⓘ | 13.18 | 182 bps | 14.95 | -213 bps | 13.11 | -408 bps | 8.77 | -560 bps |
| Net Profit Mgn % ⓘ | 9.66 | 153 bps | 10.32 | -133 bps | 10.55 | -344 bps | 6.89 | -310 bps |
| Pledged * | 0.00 | 0.00 | 0.00 | 0.00 | 0.00 | 0.00 | 0.00 | 0.00 | 0.00 | 0.00 |
Overall volumes increase by 7% YoY, driven by a 6% in Delhi and a 30% growth in other geographic areas apart from Delhi. While margins were impacted due to change in gas sourcing.

Highlights from conference call:
The current gas sourcing mix, after reductions, stands at 47% from APM and Non-APM, while the remaining 53% comes from RLNG, of which two-thirds are sourced from Henry Hub and one-third from Brent-linked gas.
The company is increasing the proportion of new well gas following the reduction in APM. However, new well gas is 20% costlier than APM, which could impact the company’s profitability.
The company anticipates potential price increases in the near future in Delhi. This price hike (Rs. 2-3/kg) for CNG is not expected to significantly impact its volume growth trajectory as the company has implemented price hikes in other geographical areas without material impact on volumes.
The company has implemented a price hike in the following areas:
Kanpur, Hamirpur, and Fatehpur: Rs 4 per kg increase.
Noida, Greater Noida, Ghaziabad, Gurgaon, Karnal, and Kaithal: Rs 2 per kg increase.
Muzaffarnagar, Meerut, Shamli, Mahoba, Banda, and Chitrakoot: Rs 3 per kg increase.
Ajmer, Pali, and Rajsamand: Rs 1.5 per kg increase.
These areas contribute to 30% of the company’s total volume.
Additionally, the company is focusing on LNG and CBG to enhance both volume and profitability. Three LNG stations are currently under construction.
Management expects the volume at the end of this financial year to reach 9.5 MMSCMD and EBITDA/SCM of Rs. 7-8 in Q4.
Note: The company has declared bonus shares in a 1:1 ratio, with the record date set as 31st January 2025 to determine shareholder eligibility.
IGL reported further 20% reduction in gas allocation by nodal agency GAIL, effective from November 16, 2024. We had written about reduction in gas allocation in our earlier notes- quarterly as well as a note on change in sourcing mix.
Gas Sourcing Mix (%) | FY21 | FY22 | FY23 | FY24 |
Non-APM | 46% | 34% | 39% | 39% |
RLNG/HPHT | 17% | 29% | 23% | 28% |
APM | 37% | 38% | 35% | 33% |
As mentioned above, company has diversified gas sourcing mix. APM (administered price mechanism; government allocated) sourced gas is ~35% lower than spot prices and hence company could maintain healthy profitability. Now allocation of this is reduced by ~40% and hence raw material costs will increase.
What triggers can make up for this increase in raw material costs?
Overall volumes increased by 9% YoY, driven by a 7% growth in Delhi NCR and a 29% growth in newer geographic areas (Noida, Ghaziabad are expanding at a rate of 17-18%). While margins were impacted due to change in gas sourcing, company’s growth plans are intact.

Highlights from the conference call-
Gas sourcing mix
We have written about reduction in gas allocation to CGD in earlier note (read). Management commented that they have secured short term RLNG (regassified liquefied natural gas) supplies and will enter into long term gas supply contracts after evaluation (mostly in next financial year). Also, the company doesn’t anticipate any drastic cut in future.
The Industrial and Commercial segment, being entirely reliant on RLNG, is inherently linked to market prices. However, the pricing remains competitive compared to alternative fuels. The Domestic PNG segment continues to receive 105% of its allocated gas, ensuring uninterrupted supply. The impact of the recent gas allocation reduction is primarily felt in the CNG segment.
Future plans and capital expenditure
Other highlights-
Moneyworks4me Opinion-
What is mentioned in company notification to exchanges?
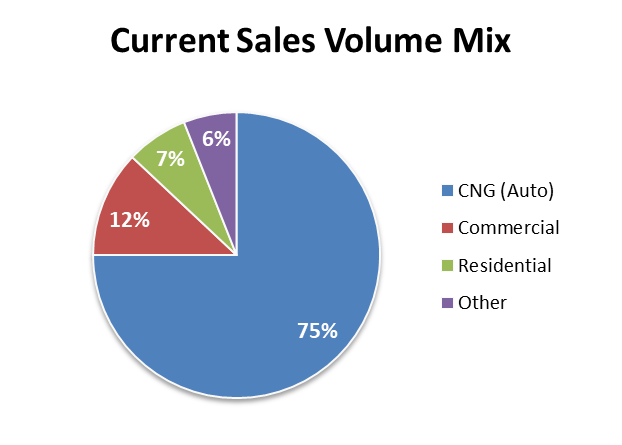
The company gets domestic gas allocation for meeting the requirement of CNG sales volumes (majorly auto; 75% of overall volumes) at the pricing fixed by the Govt. (presently at $6.5/mmbtu). The revised domestic gas allocation to company is approx. 21 % lesser than previous allocation. The company is in discussion with key stakeholders to minimize the impact.
How has the market reacted?
The stock has corrected ~10% since morning and currently trades around Rs. 450.
What is our take?
IGL sources on average about 1/3rd from APM (administered price mechanism) source, RLNG is long term sourced from mix of APM/NAPM (non-administered price mechanism). At most the impact of lower allocation from APM source will be ~10% on overall raw material volumes (21%* APM sourced ~50%). IGL can source the same from open market, as it already does (Spot prices are ~11 mmbtu), increasing overall pricing by ~7-8%.

Moneyworks4me Opinion-
Steady volume growth focus on improving EBITDA per SCM above Rs. 7.5
Particulers | Q1FY25 (Rs. Cr) | YoY Trend | Comment |
Revenue | 3,521 | 3% | Driven largely by volume growth |
EBITDA | 582 | -9% | Maintained EBITDA per SCM at 7.4 vs 6.58 in Q4FY24 |
EBITDA Margin | 17% | -200 bps |
|
PAT | 401 | -8% |
|
Q1FY25 concall highlights-
In Q1 FY25, IGL posted a sales volume of ~786 MMSCM, which grew by ~5% on a YoY basis. This is after absorbing the decrease in CNG sales to DTC buses. Within the product mix, the company did ~587 MMSCM in CNG, and 153 MMSCM in PNG Segment (CNG & PNG segment account for 79% and 21% of total volume sales) which grew by ~5%/10% respectively on a YoY basis.
Capex Plan: The Company is expected to incur ~Rs. 1,700 Cr to Rs 1,800 Cr in FY25 (out of which ~Rs. 300 Cr spent in Q1 FY25) for capacity expansion and new initiatives like CBG (Compressed Biogas) plants and LNG stations.
New initiatives: Compressed Biogas (CBG) is a purified form of biogas with a high methane content (usually more than 90%), making it similar to compressed natural gas (CNG) in terms of energy content and utility. CBG plants will help the IGL to mitigate the risk of reducing APM (Administrative Price Mechanism) gas allocation. IGL is planning to add 10 CBG plant in this financial year for the capex of around ~Rs. 350 Cr.
About IGL
Indraprastha Gas Limited (IGL) is in the business of city gas distribution (CGD) in Delhi. IGL also supplies the gas to the nearby regions of Noida, Greater Noida, Ghaziabad, Hapur, Gurugram, Meerut, Shamli, Kanpur, Muzaffarnagar, Karnal and Rewari, Hamirpur, Fatehpur, Ajmer, Pali, Rajasmand.
IGL is formed as a JV promoted by GAIL (India) Limited and Bharat Petroleum Corporation (BPCL), each owning 22.5% equity. Also, Government of NCT of Delhi is holding 5% equity.
What are its Product Segment?
CGD sector has two segments - Compressed Natural Gas (CNG) predominantly used as auto-fuel, and Piped Natural Gas (PNG) used in in domestic, commercial and Industrial segments
Currently IGL derives 75% of its volume from CNG segment and remaining 25% from PNG segment.
What was historical Growth Rate?
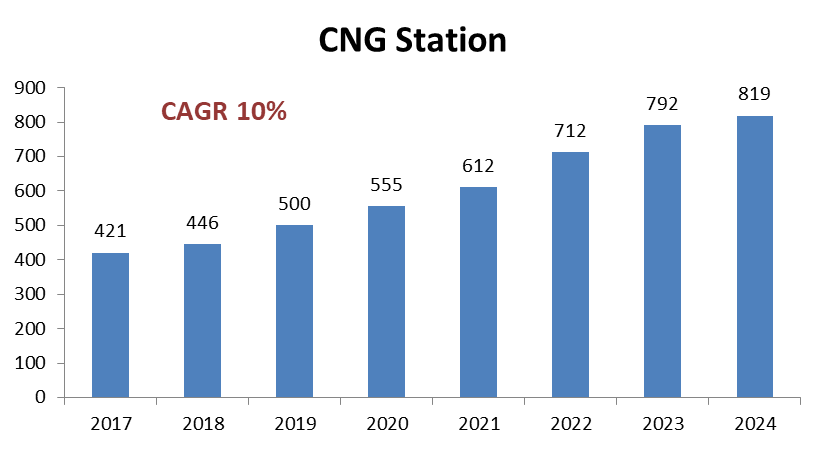
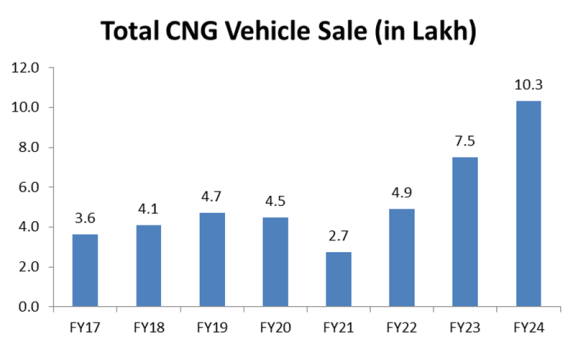
Over the last seven years, IGL has achieved a compound annual growth rate of 9% in the CNG segment's volume and 10% in the PNG segment's volume. During the same period IGL has increased its CNG infrastructure by 10%.
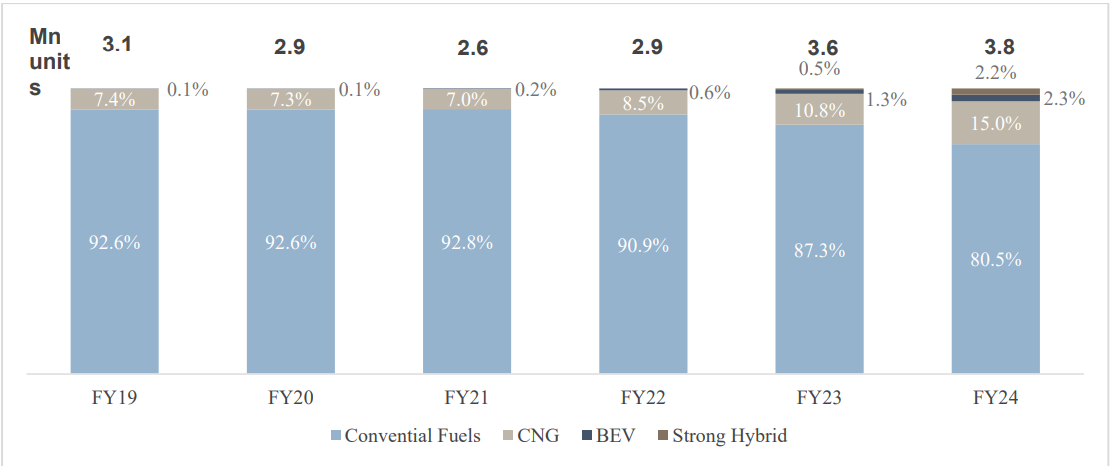
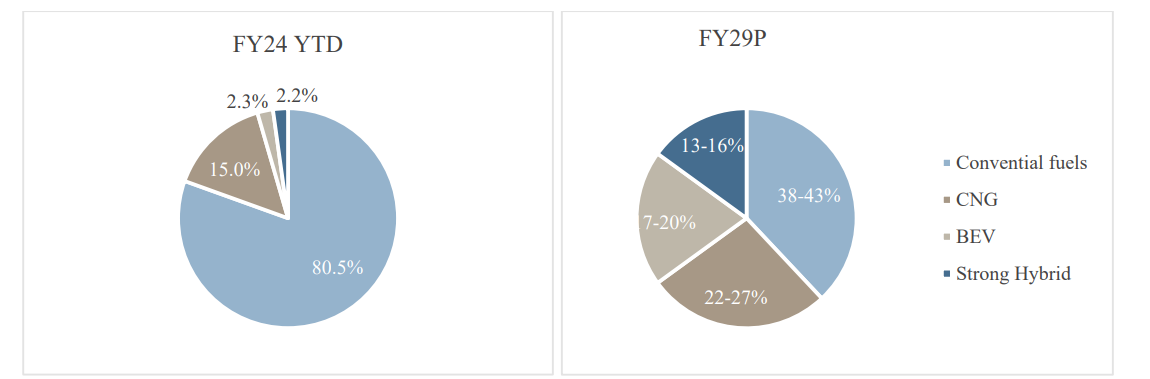
The share of CNG variants in passenger vehicle expanded from 7.4% in FY19 to 15% by FY24.
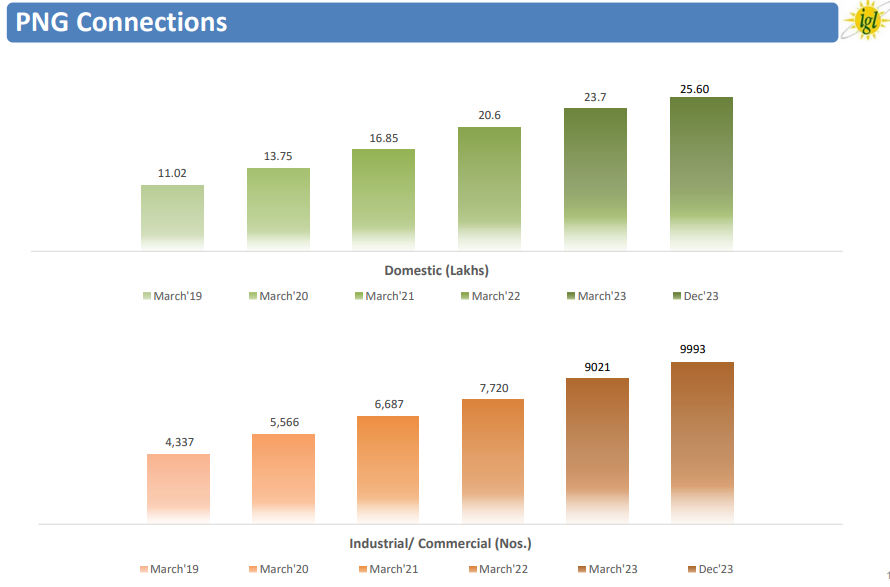
Since March 2019 IGL has expanded its PNG connection network significantly, growing from approximately 11 lakh to around 26 lakh domestic connections and from 4,337 to 9,993 industrial/commercial connections.
What is Future growth rate?
India has embarked on an ambitious trajectory to amplify its existing 6% share of natural gas in the energy basket to 15% by 2030. CGD will play pivotal role in the same. Healthy growth in CNG station infrastructure will drive the growth of CNG vehicle share. According CRISIL MI&A, by FY29 share of passenger vehicle CNG variants is estimated to rise to 22-27% from the 15% share clocked in FY24.
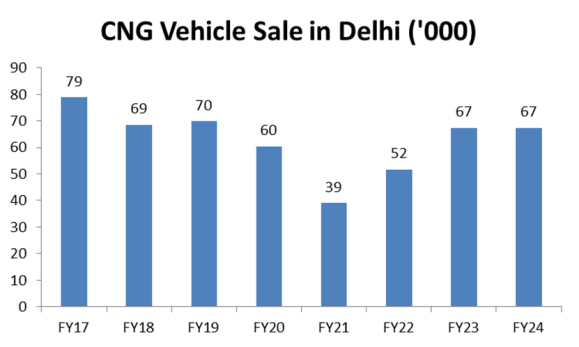
Delhi being early adopter of CNG infrastructure saw significant CNG vehicle penetration during 2017-18 period due to ban on diesel vehicles. Sales peaked at 79,000 units in FY17 and have since stabilized around 67,000 units in FY24. This trend indicates that while Delhi's market for CNG vehicles is reaching saturation, the overall CNG fleet continues to grow at a moderate pace. Future growth opportunities for CNG vehicle sales are expected to come from less penetrated regions, particularly in Uttar Pradesh, where CNG infrastructure is still developing.
What is the future Capex Plan?
IGL has envisaged annual capex of around Rs. 1,200 crore from FY24 to FY26. This capex will be for development of CGD network in the newly awarded GAs (Geographical Areas) and expansion of CGD network in its already authorised / operational areas. The said capex plans of IGL are envisaged to be funded through internal accruals. As of March 2024 IGL has Rs. 2,149 Cr cash and bank balance.
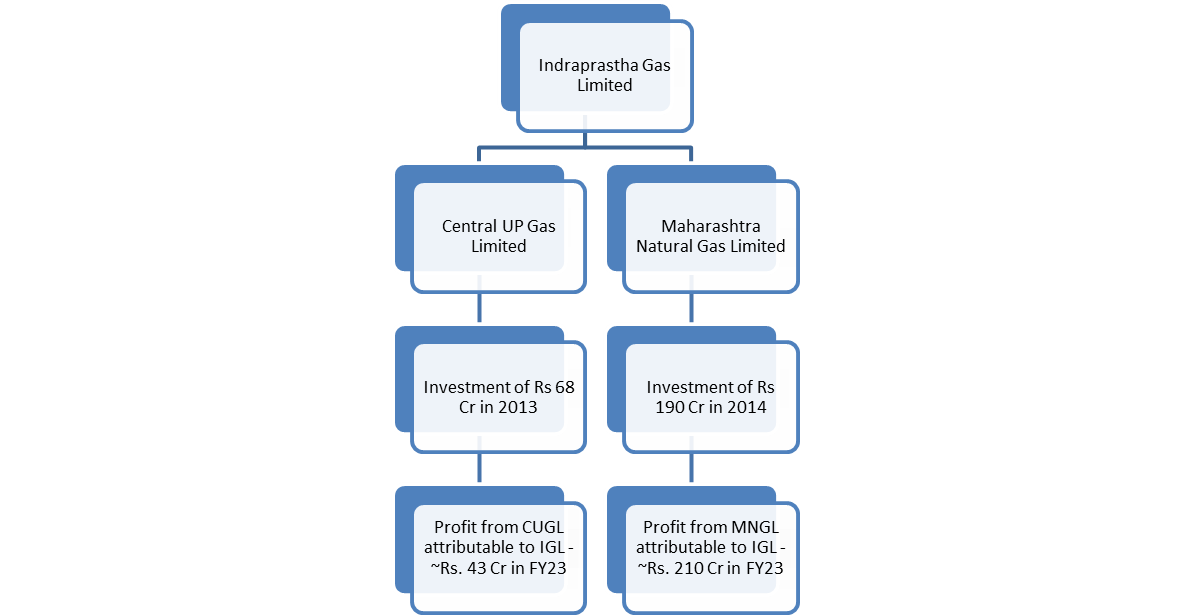
What are the other Investments?
IGL has acquired 50% stake in the two CGD companies
What are the concern areas?
| Company Name | CMP(₹) | |||||||
|---|---|---|---|---|---|---|---|---|
| Gujarat Gas | 370.4 | -9.9 (-2.6%) | Mid Cap | 15,690 | 18.4 | 7 | 20.6 | 3.2 |
| Indraprastha Gas | 189.5 | -6.7 (-3.4%) | Mid Cap | 14,000 | 10.7 | 12.5 | 18.3 | 2.8 |
| PARTICULARS | Mar'15 | Mar'16 | Mar'17 | Mar'18 | Mar'19 | Mar'20 | Mar'21 | Mar'22 | Mar'23 | Mar'24 |
|---|---|---|---|---|---|---|---|---|---|---|
| Sales | 3,681 | 3,686 | 3,815 | 4,535 | 5,765 | 6,485 | 4,941 | 7,710 | 14,133 | 14,000 |
| Operating Expenses ⓘ | 2,883 | 2,907 | 2,845 | 3,413 | 4,497 | 4,953 | 3,447 | 5,817 | 12,091 | 11,615 |
| Manufacturing Costs | 384 | 433 | 487 | 582 | 686 | 789 | 769 | 903 | 1,104 | 1,144 |
| Material Costs | 2,341 | 2,276 | 2,084 | 2,491 | 3,397 | 3,679 | 2,230 | 4,392 | 10,436 | 9,813 |
| Employee Cost | 66 | 78 | 92 | 106 | 143 | 152 | 134 | 176 | 188 | 227 |
| Other Costs ⓘ | 92 | 120 | 183 | 234 | 271 | 334 | 314 | 346 | 363 | 431 |
| Operating Profit ⓘ | 798 | 779 | 969 | 1,122 | 1,268 | 1,532 | 1,494 | 1,893 | 2,042 | 2,385 |
| Operating Profit Margin (%) | 21.7% | 21.1% | 25.4% | 24.7% | 22.0% | 23.6% | 30.2% | 24.5% | 14.4% | 17.0% |
| Other Income ⓘ | 35 | 30 | 65 | 100 | 146 | 156 | 150 | 215 | 276 | 363 |
| Interest ⓘ | 35 | 14 | 7 | 9 | 13 | 20 | 22 | 25 | 27 | 28 |
| Depreciation ⓘ | 149 | 156 | 167 | 181 | 201 | 252 | 290 | 317 | 363 | 414 |
| Exceptional Items ⓘ | 0 | 0 | 0 | 0 | 0 | 0 | 0 | 0 | 0 | 0 |
| Profit Before Tax ⓘ | 649 | 638 | 861 | 1,032 | 1,200 | 1,416 | 1,331 | 1,766 | 1,928 | 2,307 |
| Tax ⓘ | 211 | 219 | 290 | 362 | 413 | 279 | 326 | 451 | 483 | 559 |
| Profit After Tax | 438 | 419 | 571 | 671 | 787 | 1,137 | 1,006 | 1,315 | 1,445 | 1,748 |
| PAT Margin (%) | 11.9% | 11.4% | 15.0% | 14.8% | 13.6% | 17.5% | 20.4% | 17.1% | 10.2% | 12.5% |
| Adjusted EPS (₹) | 3.1 | 3.0 | 4.1 | 4.8 | 5.6 | 8.1 | 7.2 | 9.4 | 10.3 | 12.5 |
| Dividend Payout Ratio (%) | 19% | 20% | 21% | 21% | 21% | 17% | 25% | 29% | 63% | 36% |
| PARTICULARS | Mar'15 | Mar'16 | Mar'17 | Mar'18 | Mar'19 | Mar'20 | Mar'21 | Mar'22 | Mar'23 | Mar'24 |
|---|---|---|---|---|---|---|---|---|---|---|
Equity and Liabilities | ||||||||||
| Shareholders Fund | 2,098 | 2,516 | 2,927 | 3,513 | 4,130 | 5,062 | 5,872 | 6,936 | 7,087 | 8,552 |
| Share Capital ⓘ | 140 | 140 | 140 | 140 | 140 | 140 | 140 | 140 | 140 | 140 |
| Reserves ⓘ | 1,958 | 2,376 | 2,787 | 3,373 | 3,990 | 4,922 | 5,732 | 6,796 | 6,947 | 8,412 |
| Minority Interest | 0 | 0 | 0 | 0 | 0 | 0 | 0 | 0 | 0 | 0 |
| Debt | 145 | 0 | 0 | 0 | 0 | 0 | 0 | 0 | 0 | 0 |
| Long Term Debt | 145 | 0 | 0 | 0 | 0 | 0 | 0 | 0 | 0 | 0 |
| Short Term Debt | 0 | 0 | 0 | 0 | 0 | 0 | 0 | 0 | 0 | 0 |
| Trade Payables | 189 | 161 | 274 | 339 | 326 | 225 | 419 | 787 | 904 | 985 |
| Others Liabilities ⓘ | 986 | 704 | 886 | 1,077 | 1,493 | 1,885 | 2,297 | 2,729 | 3,788 | 3,584 |
| Total Liabilities ⓘ | 3,419 | 3,381 | 4,086 | 4,928 | 5,949 | 7,172 | 8,587 | 10,452 | 11,779 | 13,121 |
Fixed Assets | ||||||||||
| Gross Block | 3,176 | 2,147 | 2,400 | 2,889 | 3,518 | 4,414 | 5,450 | 6,340 | 7,389 | 8,666 |
| Accumulated Depreciation | 1,220 | 128 | 282 | 457 | 642 | 857 | 1,129 | 1,338 | 1,655 | 2,067 |
| Net Fixed Assetsⓘ | 1,956 | 2,019 | 2,117 | 2,432 | 2,877 | 3,557 | 4,321 | 5,002 | 5,734 | 6,599 |
| CWIP ⓘ | 254 | 267 | 352 | 386 | 478 | 777 | 847 | 1,379 | 1,434 | 1,396 |
| Investmentsⓘ | 291 | 259 | 677 | 1,148 | 1,544 | 258 | 1,826 | 1,976 | 677 | 1,158 |
| Inventories | 41 | 58 | 52 | 52 | 51 | 51 | 46 | 46 | 49 | 52 |
| Trade Receivables | 235 | 251 | 201 | 226 | 221 | 170 | 261 | 521 | 903 | 1,019 |
| Cash Equivalents | 231 | 454 | 609 | 558 | 607 | 2,180 | 1,132 | 1,362 | 2,132 | 2,149 |
| Others Assetsⓘ | 411 | 73 | 78 | 126 | 171 | 179 | 155 | 168 | 849 | 748 |
| Total Assets ⓘ | 3,419 | 3,381 | 4,086 | 4,928 | 5,949 | 7,172 | 8,587 | 10,452 | 11,779 | 13,121 |
| PARTICULARS | Mar'15 | Mar'16 | Mar'17 | Mar'18 | Mar'19 | Mar'20 | Mar'21 | Mar'22 | Mar'23 | Mar'24 |
|---|---|---|---|---|---|---|---|---|---|---|
| Cash Flow From Operating Activity ⓘ | 664 | 653 | 946 | 879 | 1,157 | 1,361 | 1,546 | 1,898 | 2,231 | 1,536 |
| PBT ⓘ | 649 | 638 | 861 | 1,032 | 1,200 | 1,416 | 1,331 | 1,766 | 1,928 | 2,307 |
| Adjustment ⓘ | 151 | 142 | 110 | 93 | 62 | 117 | 157 | 130 | 139 | 98 |
| Changes in Working Capital ⓘ | 41 | 60 | 245 | 84 | 264 | 172 | 347 | 378 | 647 | -383 |
| Tax Paid ⓘ | -177 | -187 | -269 | -330 | -369 | -344 | -289 | -376 | -483 | -487 |
| Cash Flow From Investing Activity ⓘ | -364 | -175 | -1,114 | -717 | -1,121 | -521 | -1,826 | -1,585 | -841 | -1,095 |
| Capex | -214 | -232 | -271 | -470 | -681 | -963 | -883 | -1,337 | -1,122 | -1,202 |
| Net Investments | -181 | 32 | -900 | -273 | -486 | 401 | -1,079 | -322 | 825 | -797 |
| Others ⓘ | 31 | 26 | 57 | 26 | 46 | 42 | 135 | 75 | -544 | 905 |
| Cash Flow From Financing Activityⓘ | -327 | -256 | -160 | -84 | -169 | -243 | -297 | -328 | -1,359 | -334 |
| Net Proceeds from Shares ⓘ | 0 | 0 | 0 | 0 | 0 | 0 | 0 | 0 | 0 | 0 |
| Net Proceeds from Borrowing ⓘ | -173 | -145 | 0 | 0 | 0 | 0 | 0 | 0 | 0 | 0 |
| Interest Paid ⓘ | -30 | -10 | 0 | 0 | 0 | 0 | 0 | 0 | 0 | 0 |
| Dividend Paid ⓘ | -77 | -84 | -133 | -70 | -140 | -168 | -196 | -252 | -1,295 | -280 |
| Others ⓘ | -47 | -17 | -27 | -14 | -29 | -75 | -101 | -77 | -64 | -54 |
| Net Cash Flow ⓘ | -27 | 223 | -328 | 78 | -133 | 597 | -577 | -15 | 31 | 107 |
| PARTICULARS | Mar'15 | Mar'16 | Mar'17 | Mar'18 | Mar'19 | Mar'20 | Mar'21 | Mar'22 | Mar'23 | Mar'24 |
|---|---|---|---|---|---|---|---|---|---|---|
| Ratios | ||||||||||
| ROE (%) | 22.67 | 18.16 | 20.98 | 20.83 | 20.59 | 24.73 | 18.39 | 20.53 | 20.61 | 22.36 |
| ROCE (%) | 31.36 | 27.42 | 31.88 | 32.33 | 31.74 | 31.24 | 24.76 | 27.96 | 27.88 | 29.86 |
| Asset Turnover Ratio | 1.21 | 1.2 | 1.13 | 1.11 | 1.17 | 1.09 | 0.69 | 0.89 | 1.4 | 1.24 |
| PAT to CFO Conversion(x) | 1.52 | 1.56 | 1.66 | 1.31 | 1.47 | 1.2 | 1.54 | 1.44 | 1.54 | 0.88 |
| Working Capital Days | ||||||||||
| Receivable Days | 20 | 22 | 20 | 16 | 13 | 10 | 14 | 17 | 17 | 23 |
| Inventory Days | 4 | 4 | 5 | 4 | 3 | 3 | 3 | 2 | 1 | 1 |
| Payable Days | 29 | 28 | 38 | 45 | 36 | 27 | 53 | 50 | 30 | 35 |
Indraprastha Gas Limited (IGL) is incorporated in 1998, the company is a Joint Venture of GAIL and BPCL. Government of National Capital Territory (NCT) of Delhi is also holding 5% equity. The company was listed in stock exchange in December 2003. IGL started its operations in NCT of Delhi in 1999 with only 9 CNG stations and 1000 PNG consumers.
The project was started to lay the network for the distribution of natural gas in the National Capital Territory of Delhi to consumers in the domestic, transport, and commercial sectors. With the backing of strong promoters - GAIL (India) and Bharat Petroleum Corporation (BPCL) - IGL plans to provide natural gas in the entire capital region.
Business area of the company
The company mainly operates in two businesses, they are:
Products
PNG - PNG is mainly methane - CH4 with a small percentage of other higher hydrocarbons. The ratio of carbon to hydrogen is least in methane and hence it burns almost completely making it the cleanest fuel. It is procured from the oil / gas wells and transported through a network of pipelines across the country.
CNG - CNG stands for compressed natural gas. It is gaseous fuel and is a mixture of hydrocarbons mainly Methane. For use in Automobiles as fuel, it is compressed to a pressure of 200-250 Kg/cm² to enhance the vehicle on-board storage capacity.CNG is a fossil fuel substitute for other auto fuels such as petrol, diesel, Auto LPG etc.
Commercial & Industrial Usage - Natural gas is a versatile fuel which is gaining immense popularity for Industrial and commercial usage. Under the commercial sector all leading hotels, restaurants, malls, commercial complexes and hospitals in the Delhi & NCR are being supplied PNG by IGL. In the industrial sector, PNG is being used to run boilers, furnaces, ovens, hot water generators, thermifluid heaters, gas turbines for power generation and Vapour Absorption Machines (VAM) for heating and cooling applications. Industries have saved on cost and storage space by using PNG and in turn pollution levels have also gone down.
Awards for CSR activities:

MoneyWorks4Me rating and ranking of funds for SIP is available to subscribers only. Moneyworks4Me is not a rating and ranking agency, however it is required that users have a way of selecting funds and building a Portfolio. The method used by it are described below to enable users to understand the logic behind the rating and ranking Subscriber will find more details on this in the various content made available from time to time. In case you need more please write to besafe@moneyworks4Me.com
MoneyWorks4Me rates and ranks mutual funds based on the following data-driven system:
Funds ranking in screeners: Performance Consistency and Quality are two parameters used for ranking funds for SIP. The ranking as follows GG, GO, GR, OG, OO, OR, RG, RO and RR.
With the same color-coded funds, the one with the higher Average 3-year rolling returns (over 5 to 10 years), the number that appears in the Performance tag, ranks higher.
Here is the summary:
The third tag Upside Potential is not relevant for SIP. It is relevant for lumpsum investments in Mutual Funds.

Make an informed decision for Stocks
Invest using an intelligent system with powerful data-driven tools that help you identify opportunities and make informed buy-hold-sell decisions
Buy quality Stocks when they are available at reasonable prices and supported by an upward price trend and Sell when they are Overvalued using the Decizen Rating System. Covers 3500+ stocks

Account Discovery
- OTP from CAMS
Account Linking for Stocks & MF
- One OTP per link Eg. NSDL, CDSL, CAMS, KFin etc.
One Click Upload for your Current Portfolio and Future Transactions!
Don't miss out! First 10 users today get it FREE

With this 4 hrs Masterclass, you’ll be able to:
 Download APP


