Stocks - Q : Quality | V : Valuation | PT : Price Trend
Funds - P : Performance | Q : Quality
Funds - P : Performance | Q : Quality

Past 10 year's financial track record analysis by Moneyworks4me indicates that One97 Communications Ltd is a average quality company.
The key valuation ratios of One97 Communications Ltd's currently when compared to its past seem to suggest it is in the Undervalued zone.
The Price Trend analysis by MoneyWorks4Me indicates it is Strong which suggest that the price of One97 Communications Ltd is likely to Rise in the short term. However, please check the rating on Quality and Valuation before investing
Data adjusted to bonus, split, extra-ordinary income, rights issue and change in financial year end.
Value Creation Index Colour Code Guide ⓘ
| Mar'15 | Mar'16 | Mar'17 | Mar'18 | Mar'19 | Mar'20 | Mar'21 | Mar'22 | Mar'23 | Mar'24 | TTM | |
|---|---|---|---|---|---|---|---|---|---|---|---|
| ROCE % ⓘ | -107.1% | -97.6% | -22.3% | -28.1% | -54% | -36.2% | -18.9% | -21.5% | -14.1% | -11.8% | - |
| Value Creation Index ⓘ | -10.5 | -9.7 | -3.0 | -3.5 | -5.8 | -4.2 | -2.7 | -2.9 | -2.3 | -2.1 | - |
Growth Parameters ⓘGrowth Parameters Colour Code Guide ⓘ | |||||||||||
| Sales ⓘ | 308 | 830 | 598 | 2,987 | 3,050 | 3,115 | 2,666 | 3,891 | 6,023 | 7,654 | 5,604 |
| Sales YoY Gr. | - | 169.9% | -27.9% | 399.3% | 2.1% | 2.1% | -14.4% | 45.9% | 54.8% | 27.1% | - |
| Adj EPS ⓘ | -12.3 | -34.6 | -21.5 | -26.6 | -67.7 | -43.1 | -25.3 | -35.1 | -27.9 | -21.8 | -8.9 |
| YoY Gr. | - | NA | NA | NA | NA | NA | NA | NA | NA | NA | - |
| BVPS (₹) ⓘ | 12.5 | 59.6 | 49.2 | 134.6 | 101.5 | 134.2 | 109.1 | 196.5 | 156.7 | 136.7 | 197.7 |
| Adj Net Profit ⓘ | -372 | -1,600 | -1,009 | -1,470 | -3,893 | -2,604 | -1,530 | -2,276 | -1,768 | -1,386 | -565 |
| Cash Flow from Ops. ⓘ | -340 | -1,413 | -1,832 | -2,582 | -4,355 | -2,242 | -2,002 | -1,318 | 91.6 | 225 | - |
| Debt/CF from Ops. ⓘ | 0 | -0 | -0.1 | -0.1 | -0.2 | -0.1 | -0.3 | 0 | 0 | 0 | - |
CAGR Colour Code Guide ⓘ
| 9 Years | 5 Years | 3 Years | 1 Years | |||||
|---|---|---|---|---|---|---|---|---|
| Sales ⓘ | 42.9% | 20.2% | 42.1% | 27.1% | ||||
| Adj EPS ⓘ | NA | NA | NA | NA | ||||
| BVPSⓘ | 30.5% | 6.1% | 7.8% | -12.7% | ||||
| Share Price | - | - | 12.6% | 132.4% | ||||
Performance Ratio Colour Code Guide ⓘ
| Mar'15 | Mar'16 | Mar'17 | Mar'18 | Mar'19 | Mar'20 | Mar'21 | Mar'22 | Mar'23 | Mar'24 | TTM | |
|---|---|---|---|---|---|---|---|---|---|---|---|
| Return on Equity % ⓘ | -109.3 | -101.3 | -39.2 | -29.5 | -57.2 | -36.1 | -19.9 | -22 | -13.6 | -11.3 | -5.3 |
| Op. Profit Mgn % ⓘ | -115.3 | -194 | -218.2 | -54.2 | -134.7 | -78.9 | -61.1 | -57.2 | -26.9 | -14.7 | -30.1 |
| Net Profit Mgn % ⓘ | -121.1 | -192.8 | -168.7 | -49.2 | -127.7 | -83.6 | -57.4 | -58.5 | -29.4 | -18.1 | -10.1 |
| Debt to Equity ⓘ | 0 | 0 | 0 | 0 | 0.1 | 0 | 0.1 | 0 | 0 | 0 | - |
| Working Cap Days ⓘ | 303 | 197 | 929 | 331 | 452 | 590 | 725 | 683 | 456 | 262 | 322 |
| Cash Conv. Cycle ⓘ | 29 | 5 | -4 | -2 | -1 | -53 | -3 | 11 | 16 | 31 | 254 |
Sales growth is growing at healthy rate in last 3 years 42.13%
Return on Equity is Poor
Sales growth is not so good in last 4 quarters at -27.49%
| Standalone | Consolidated | |
|---|---|---|
| TTM EPS (₹) | -8.9 | -10.5 |
| TTM Sales (₹ Cr.) | 5,604 | 7,256 |
| BVPS (₹.) ⓘ | 197.7 | 224.6 |
| Reserves (₹ Cr.) ⓘ | 12,547 | 14,260 |
| P/BV ⓘ | 4.43 | 3.90 |
| PE ⓘ | 0.00 | 0.00 |
| From the Market | |
|---|---|
| 52 Week Low / High (₹) | 310.00 / 1063.00 |
| All Time Low / High (₹) | 310.00 / 1961.05 |
| Market Cap (₹ Cr.) | 55,866 |
| Equity (₹ Cr.) | 63.8 |
| Face Value (₹) | 1 |
| Industry PE ⓘ | 398.9 |
| Mar'24 | YoY Gr. Rt. % | Jun'24 | YoY Gr. Rt. % | Sep'24 | YoY Gr. Rt. % | Dec'24 | YoY Gr. Rt. % | |
|---|---|---|---|---|---|---|---|---|
| Sales (₹ Cr.)ⓘ | 1,698 | -5.9 | 1,149 | -37.7 | 1,265 | -36.1 | 1,492 | -30.2 |
| Adj EPS (₹) ⓘ | -5.6 | N/A | -13 | N/A | -0.9 | N/A | -3.2 | N/A |
| Op. Profit Mgn % ⓘ | -16.81 | -899 bps | -67.08 | -5104 bps | -33.26 | -1985 bps | -13.98 | -499 bps |
| Net Profit Mgn % ⓘ | -21.01 | -1091 bps | -71.78 | -5381 bps | -4.69 | 1145 bps | -13.76 | -190 bps |
| Pledged * | 0.00 | 0.00 | 0.00 | 0.00 | 0.00 | 0.00 | 0.00 | 0.00 | 0.00 | 0.00 |
In a sudden development, the Reserve Bank of India (RBI) dealt a severe blow to Paytm Payments Bank (PPBL) on Wednesday, announcing a suspension of all its core services, including accounts and wallets, effective from March. While this action does not entail the revocation of PPBL's license yet, it does significantly impact the operations of One 97 Communications (the publicly listed Paytm), the parent company of PPBL.
On-ground reports indicate that Paytm's merchants are currently facing intense persuasion from rival payment platforms such as Phonepe and GooglePay, who are offering their services at zero cost. These merchants are concerned about the impending suspension of Paytm's services, and many are already making the switch.
Management has assured that they are actively working to facilitate the seamless transfer of existing Virtual Payment Accounts (VPAs) for merchants to other bank-linked VPAs during this transition period. However, in light of the situation, the financial services business of the bank will be temporarily halted, with the entire operational capacity focused on maintaining essential business operations during this crisis. This is expected to result in a substantial EBITDA loss of Rs. 300-500 Crores.
The RBI's inspection revealed several troubling issues within Paytm Payments Bank, including inoperative Paytm Wallets, instances where a single PAN card was linked to thousands of accounts, lapses in Know Your Customer (KYC) compliance for thousands of accounts, and violations of KYC-anti-money laundering regulations. Moreover, RBI was also uncomfortable with PPBL’s business co-mingling with its promoter group companies (Paytm holds 49% in PPBL whereas promoter Vijay Shekhar Sharma holds the rest 51%). These findings raised serious concerns for PPBL being in the highly regulated banking and payments industry, prompting the regulator to impose stringent restrictions on the bank, effectively grinding its operations to a halt.
Particulars | Q3FY24 (Rs. Cr) | YoY Trend | Comments |
| Revenue | 2,138 | +36% | Led by Merchants Payment Services revenue growth of 69% YoY to Rs. 2,285 Cr and Financial Service revenue growing 36% YoY to Rs. 607 Cr |
| EBITDA | -192 | NA | On the back of operating leverage losses have reduced, and EBITDA before ESOP cost has increased to Rs. 219 Cr. |
| EBITDA Margin | -9% | NA | Contribution Margin came in at 53% |
| PAT | -254 | NA |
Post-paid Loan disbursal (BNPL) grew 44% YoY to Rs. 15,535 Cr but fell 4% QoQ due to the change in business focus towards high-ticket loans. Refer Stock Pulse for details. Q4 should reflect the complete impact of the same.
What is Paytm’s business model?
Paytm operates in 3 segments:
1. Payments business: Being the flag bearer for UPI revolution in India, Paytm provides its trademark Soundbox which makes receiving payment easy for merchants. Paytm has a mobile wallet that allows users to store money and use it to make payments and transactions. Paytm platform also offers a Payments Bank account, which provides banking services such as savings accounts, debit cards, and online banking.
2. Financial Services: Paytm offers Merchant Loans, Personal loans, and Buy now pay later (BNPL) loans. Paytm has also expanded into other areas such as insurance & wealth management. Paytm partners with lenders for this business and the Lending does not come on the Balance sheet of Paytm. It acts as a direct selling agent (DSA).
3. E-Commerce: Paytm offers a wide range of services under this segment including flight/bus/train/hotel ticket booking and online shopping.
What is the recent update?
The company had observed positive trends and acceptance in its loan distribution business, prompting the introduction of newer loan offerings targeted at healthier portfolio growth. In response to recent macro developments and regulatory guidance of increasing capital adequacy requirements for NBFCs, Paytm is shifting its focus away from distributing loans under Rs. 50,000 redirecting efforts towards higher-ticket loans.
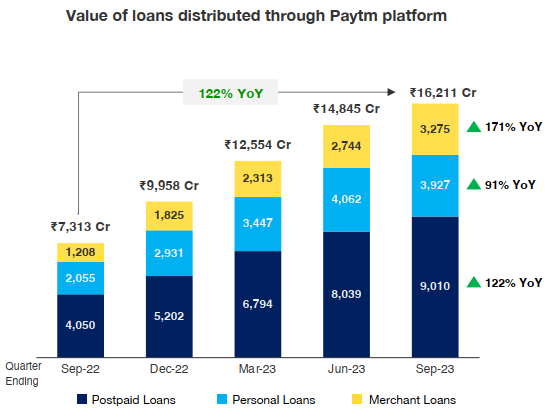
Specifically, Paytm is narrowing down its distribution of loans under Rs. 50,000 such as the postpaid loan product, to a smaller part of its business. The focus is now on providing higher-ticket loans for consumers and merchants through partnerships with banks and NBFCs. The company will concentrate on providing merchant loans to MSMEs, unaffected by recent regulatory changes due to their business-oriented nature. This strategic move aims to cater to lower-risk, creditworthy customers and enhance the portfolio performance of lending partners.
Paytm aims to expand offerings for high-value personal and merchant loans while adhering to risk management strategies. Additionally, Paytm remains focused on growing its lending partner network by integrating with one large bank and two significant NBFCs in the coming quarters.
How does this change growth prospects for the company?
Paytm had built a niche for itself with the edge it had in getting the payment history of its consumers. BNPL product was built on this edge. The path to profitability of Paytm revolved around the Right to win it had in the BNPL (Sub Rs. 50,000 Loans). Management commentary of getting the remaining disbursals through higher ticket size loans might not be very value accretive as NBFCs and small banks have their own channels for pushing out personal loans as against Paytm which is a DSA (Direct selling agent).
What changes is the company making to counter the business changes?
Even though the quantum of disbursal under the impacted segment of Postpaid was about 50% of the overall lending business (which shall be reduced by half), the take rates (revenues earned by Paytm as a DSA) are the lowest. Paytm intends to push Merchant and Personal loans aggressively going forward which have high take rates and management guides the move to curtail Postpaid as precautionary and the overall impact on revenue shall be insignificant. The mix of loan disbursals is as follows:
Segment | Postpaid | Personal Loans | Merchant Loans |
| Disbursals in (Rs. Cr FY23) | 19,400 | 9,758 | 6,160 |
| Take rate (Profit margin) | ~3% | ~4% | >5% |
The company recently announced plans to terminate over 1,000 employees across multiple units. This constitutes about 10% of its current workforce. The decision to cut jobs follows Paytm's aim to restructure, reduce costs, and realign its various businesses. The reflection of these measures shall be visible in the coming quarters.
|
Particulars |
Q1FY24 |
YoY Trend |
Comments |
|
Revenue |
1,845 |
+48% |
Average Monthly Transacting Users up 23% YoY. The loan distribution business has seen significant growth, with loans distributed reaching nearly Rs. 15,000 crores. (+167%YoY) |
|
EBITDA |
-296 |
NA |
Contribution Margin improvement of 12% YoY |
|
PAT |
-333 |
NA |
|
Healthy revenue growth led by payments & financial services. We remain watchful of Innovations in the payment ecosystem & scale up of loan distribution business.
Paytm is a digital payment platform and financial services company founded in 2010 by Vijay Shekhar Sharma. Paytm is India’s leading digital ecosystem for consumers and merchants, and has built the largest payments platform.
Paytm offers a wide range of services, including mobile recharges, bill payments, ticket booking, money transfer, and online shopping. Paytm has a mobile wallet that allows users to store money and use it to make payments and transactions. The platform also offers a Paytm Payments Bank account, which provides banking services such as savings accounts, debit cards, and online banking. In addition to its payment and banking services, Paytm has expanded into other areas such as insurance, wealth management, and e-commerce.
Industry Overview
In FY 2021, 650 - 700 million Indians had access to the internet and the number is expected to increase to over 950-1,000 million by FY 2026 representing more than 70% of the total population, this is primarily driven by increasing smartphone penetration, reducing data cost, new technology innovations and Government’s push towards digitization.
India’s digital payments market is at an inflection point and is expected to more than triple from US$3 trillion in FY21 to US$10 trillion by 2026. During the FY 2021-22, India’s volume of digital payments increased by 33% year on year (YoY). According to the Ministry of Electronics and Information Technology (MeitY), there were 7,422 Cr digital payment transactions in FY2021-22 up from 5,554 Cr in FY2020-21. UPI transactions share of online credit is estimated to grow 40% in FY22 to 70% by FY26, further digital merchant payments from US$ 0.3-0.4 trillion in FY22 to US$ 2.5-2.7 trillion by 2026.
India has more than 4 Cr merchants with a potential to reach 10 Cr. MSME credit is an underpenetrated market with various Banks, MFI, NBFC & financial institutions working towards increasing their credit to this segment, but insufficient data make credit extended to this segment low in comparison to need, Fintech & UPI are at forefront of changing this dynamic. Transaction data & history allows fintechs to extend credit to ones that won’t have cleared traditional banking metrics.
Business Model
Payment Services
Paytm's core business is digital payments and financial services; it offers a wide range of payment options, including mobile wallets, debit and credit cards, and net banking. To merchants it offers certain products and services such as Paytm Soundbox and Point of Sale (POS). Its GMV for FY23 stood at 13.2 Lakh Cr, as compared to 8.5 Lakh Cr in FY22. Paytm has a share of 13% in overall UPI payments. But it’s the peer-to-merchant segment (P2M) where it’s truly dominant with a 50% share. Company earns revenue from take rate it charges on GMV of payments made through its wallet
Financial Services
Under this segment Paytm uses its reach and size of payment services, data & history with users to distribute and develop financial products. Paytm's existing large base of active consumers and merchants provides a low cost of distribution network for loan origination. It acts as a platform between lenders and seekers of capital based on user’s transaction data. It provides merchant loans, personal loans & Buy-Now pay later (BNPL) loans to its customer base.
Company generates revenue by charging a take rate (2.5-3.5% for loan sourcing, 0.5-1.5% for loan collection) on different loans.
This segment provides huge revenue potential as it leverages existing user data, to process and create pool of credit worthy users. Giving Paytm an edge to service demand for credit for users who would have been denied loans in traditional banking sense.
Although currently Paytm doesn’t hold any risk on its balance sheet, this could change in future as competition rises.

Commerce and Cloud Services
Paytm provides a range of services & platform to merchants to help them connect with consumers, increase demand for their products and services, and improve their business operations. This includes targeted outreach to consumers for services such as ticketing, deals, loyalty programs, mini-apps, and advertising. Paytm earns take rate of around 6% of GMV under this segment.
Under software and cloud services it offers various aspects of their business, such as billing, vendor management, customer promotions, inventory management, and ledger management. To enterprises, telecom companies, and digital and fintech platforms, it provides services like tracking and enhancing customer engagement, building payment systems, unlocking customer insights, and driving higher conversion rates for commerce offerings. Company charges fees per month to merchants and advertising cost to enterprises.
Loss Leader Perspective
PayTm follows a loss leader game, where it losses or makes very little profits. This can be seen in payment services segment, as well sound box on boarding. But these losses have been able to provide Paytm with wide range of revenue streams from providing services to vendors, loan sourcing and cloud.
Business Performance
|
|
FY23 |
FY22 |
FY21 |
|
Revenue |
7,990 |
4,974 |
2,802 |
|
Contribution Profit |
3,900 |
1,498 |
363 |
|
EBITDA |
-1,632 |
-2,327 |
-1,766 |
|
PAT |
-1,776 |
-2,396 |
-1,655 |
Competition
Paytm compete with Google Pay, PhonePe, BharatPe & other UPI platforms in payment services space. In loan origination & financial segment from various BNPL providers as well other UPI platforms in similar space.
Risks
Reduction in Wallet & UPI take rate can affect payment service revenue.
Decrease in take rate in lending segment, as well taking part in risk on loan disbursed.
Decline in ecommerce GMV and take rates.
ESOP dilution by promoters could mean that company will grow, but returns to shareholders might be negatively disproportionate.
Lower MDR charged to merchants, a reverse scenario could create an upside potential for Paytm as UPI transactions could start carrying a take rate.
| Company Name | CMP(₹) | |||||||
|---|---|---|---|---|---|---|---|---|
| One97 Communications | 875.9 | -30 (-3.3%) | Small Cap | 7,654 | -8.9 | -18.1 | - | 4.6 |
| Infibeam Avenues | 17.5 | -0.8 (-4.4%) | Small Cap | 3,171 | 0.8 | 4.7 | 22.6 | 1.4 |
| One Mobikwik Systems | 264.5 | -13.1 (-4.7%) | Small Cap | 867 | 1.2 | 1 | 241.1 | 3.1 |
| Suvidhaa Infoserve | 4.1 | 0.1 (2.8%) | Small Cap | 5.6 | -0.5 | -259.2 | - | 0.8 |
| RNFI Services | - | 0 (0%) | Small Cap | 0 | - | - | - | - |
| MOS Utility | - | 0 (0%) | Small Cap | 0 | - | - | - | - |
| Paymate India | - | 0 (0%) | Small Cap | 0 | - | - | - | - |
| India1 Payment | - | 0 (0%) | Small Cap | 0 | - | - | - | - |
| PARTICULARS | Mar'15 | Mar'16 | Mar'17 | Mar'18 | Mar'19 | Mar'20 | Mar'21 | Mar'22 | Mar'23 | Mar'24 |
|---|---|---|---|---|---|---|---|---|---|---|
| Sales | 308 | 830 | 598 | 2,987 | 3,050 | 3,115 | 2,666 | 3,891 | 6,023 | 7,654 |
| Operating Expenses ⓘ | 662 | 2,441 | 1,904 | 4,607 | 7,159 | 5,580 | 4,343 | 6,186 | 7,724 | 8,903 |
| Manufacturing Costs | 35 | 307 | 20 | 319 | 378 | 352 | 2,086 | 2,371 | 2,019 | 2,125 |
| Material Costs | 0 | 0 | 0 | 0 | 0 | 0 | 0 | 0 | 0 | 0 |
| Employee Cost | 118 | 237 | 324 | 529 | 628 | 825 | 834 | 1,907 | 3,258 | 4,030 |
| Other Costs ⓘ | 509 | 1,897 | 1,559 | 3,759 | 6,153 | 4,402 | 1,423 | 1,908 | 2,447 | 2,748 |
| Operating Profit ⓘ | -355 | -1,611 | -1,305 | -1,619 | -4,109 | -2,465 | -1,677 | -2,296 | -1,701 | -1,249 |
| Operating Profit Margin (%) | -115.0% | -194.0% | -218.0% | -54.2% | -134.0% | -79.1% | -62.9% | -59.0% | -28.2% | -16.3% |
| Other Income ⓘ | 17 | 90 | 166 | 247 | 342 | 147 | 375 | 283 | 400 | 526 |
| Interest ⓘ | 2 | 1 | 4 | 28 | 20 | 50 | 36 | 40 | 22 | 25 |
| Depreciation ⓘ | 20 | 27 | 39 | 69 | 76 | 143 | 157 | 228 | 470 | 721 |
| Exceptional Items ⓘ | -7 | -1 | 591 | -2 | -91 | -322 | -65 | -44 | -63 | -8 |
| Profit Before Tax ⓘ | -367 | -1,550 | -591 | -1,471 | -3,954 | -2,833 | -1,560 | -2,325 | -1,856 | -1,476 |
| Tax ⓘ | 3 | -2 | 4 | -1 | 0 | 0 | 0 | 0 | 0 | 0 |
| Profit After Tax | -371 | -1,549 | -595 | -1,470 | -3,954 | -2,833 | -1,560 | -2,325 | -1,856 | -1,476 |
| PAT Margin (%) | -120.0% | -186.0% | -99.4% | -49.2% | -129.0% | -90.9% | -58.5% | -59.8% | -30.8% | -19.3% |
| Adjusted EPS (₹) | -12.3 | -33.5 | -12.7 | -26.6 | -68.7 | -46.9 | -25.8 | -35.8 | -29.3 | -23.2 |
| Dividend Payout Ratio (%) | 0% | 0% | 0% | 0% | 0% | 0% | 0% | 0% | 0% | 0% |
| PARTICULARS | Mar'15 | Mar'16 | Mar'17 | Mar'18 | Mar'19 | Mar'20 | Mar'21 | Mar'22 | Mar'23 | Mar'24 |
|---|---|---|---|---|---|---|---|---|---|---|
Equity and Liabilities | ||||||||||
| Shareholders Fund | 378 | 2,755 | 2,309 | 7,448 | 5,838 | 8,108 | 6,602 | 12,754 | 9,934 | 8,696 |
| Share Capital ⓘ | 30 | 46 | 47 | 55 | 58 | 60 | 61 | 65 | 63 | 64 |
| Reserves ⓘ | 348 | 2,709 | 2,262 | 7,392 | 5,780 | 8,048 | 6,542 | 12,689 | 9,870 | 8,632 |
| Minority Interest | 0 | 0 | 0 | 0 | 0 | 0 | 0 | 0 | 0 | 0 |
| Debt | 0 | 15 | 90 | 242 | 722 | 201 | 544 | 0 | 0 | 0 |
| Long Term Debt | 0 | 0 | 0 | 0 | 27 | 0 | 0 | 0 | 0 | 0 |
| Short Term Debt | 0 | 15 | 90 | 242 | 696 | 201 | 544 | 0 | 0 | 0 |
| Trade Payables | 141 | 263 | 222 | 426 | 673 | 573 | 614 | 711 | 783 | 565 |
| Others Liabilities ⓘ | 176 | 392 | 1,267 | 440 | 1,450 | 1,624 | 1,719 | 2,892 | 4,920 | 5,729 |
| Total Liabilities ⓘ | 695 | 3,425 | 3,888 | 8,556 | 8,683 | 10,507 | 9,480 | 16,357 | 15,636 | 14,989 |
Fixed Assets | ||||||||||
| Gross Block | 183 | 230 | 199 | 289 | 477 | 840 | 848 | 1,482 | 2,182 | 2,783 |
| Accumulated Depreciation | 137 | 152 | 57 | 123 | 191 | 332 | 458 | 652 | 1,045 | 1,601 |
| Net Fixed Assetsⓘ | 46 | 78 | 141 | 166 | 286 | 508 | 391 | 830 | 1,137 | 1,183 |
| CWIP ⓘ | 10 | 58 | 72 | 20 | 51 | 12 | 23 | 11 | 8 | 11 |
| Investmentsⓘ | 123 | 2,319 | 592 | 5,188 | 3,440 | 4,212 | 1,299 | 1,305 | 2,493 | 4,337 |
| Inventories | 0 | 0 | 0 | 0 | 0 | 0 | 0 | 0 | 0 | 0 |
| Trade Receivables | 93 | 108 | 93 | 505 | 242 | 328 | 492 | 706 | 1,142 | 1,470 |
Cash Equivalents  ⓘ ⓘ
| 141 | 450 | 557 | 287 | 241 | 369 | 2,573 | 4,835 | 6,312 | 4,148 |
| Others Assetsⓘ | 281 | 412 | 2,433 | 2,391 | 4,422 | 5,079 | 4,703 | 8,669 | 4,544 | 3,841 |
| Total Assets ⓘ | 695 | 3,425 | 3,888 | 8,556 | 8,683 | 10,507 | 9,480 | 16,357 | 15,636 | 14,989 |
| PARTICULARS | Mar'15 | Mar'16 | Mar'17 | Mar'18 | Mar'19 | Mar'20 | Mar'21 | Mar'22 | Mar'23 | Mar'24 |
|---|---|---|---|---|---|---|---|---|---|---|
| Cash Flow From Operating Activity ⓘ | -340 | -1,413 | -1,832 | -2,582 | -4,355 | -2,242 | -2,002 | -1,318 | 92 | 225 |
| PBT ⓘ | -367 | -1,550 | -591 | -1,491 | -3,954 | -2,833 | -1,560 | -2,325 | -1,856 | -1,476 |
| Adjustment ⓘ | 18 | 14 | -935 | -13 | -52 | 587 | 68 | 874 | 1,641 | 2,051 |
| Changes in Working Capital ⓘ | 25 | 201 | -264 | -913 | -164 | 29 | -709 | 231 | 455 | -259 |
| Tax Paid ⓘ | 16 | 36 | -42 | -164 | -180 | -25 | 199 | -99 | -149 | -91 |
| Cash Flow From Investing Activity ⓘ | -5 | -2,270 | 1,676 | -4,267 | 1,709 | -2,181 | 1,718 | -5,472 | 2,946 | 608 |
| Capex | -23 | -92 | -115 | -41 | -153 | -168 | -173 | -503 | -678 | -803 |
| Net Investments | 0 | 0 | 1,762 | -3,952 | 2,034 | -2,042 | 2,224 | -5,053 | 3,285 | 946 |
| Others ⓘ | 18 | -2,178 | 29 | -273 | -172 | 29 | -333 | 84 | 339 | 465 |
| Cash Flow From Financing Activityⓘ | 459 | 3,993 | 420 | 6,401 | 2,861 | 5,169 | -208 | 8,062 | -1,101 | 7 |
| Net Proceeds from Shares ⓘ | 465 | 3,984 | 400 | 6,437 | 2,189 | 5,054 | 11 | 8,307 | 1 | 2 |
| Net Proceeds from Borrowing ⓘ | 0 | 0 | 0 | 0 | 0 | 0 | 0 | 0 | 0 | 0 |
| Interest Paid ⓘ | 0 | 0 | -4 | -12 | 0 | -45 | -33 | -37 | -19 | -17 |
| Dividend Paid ⓘ | 0 | 0 | 0 | 0 | 0 | 0 | 0 | 0 | 0 | 0 |
| Others ⓘ | -6 | 9 | 24 | -24 | 672 | 160 | -185 | -208 | -1,083 | 23 |
| Net Cash Flow ⓘ | 114 | 309 | 264 | -448 | 215 | 746 | -492 | 1,273 | 1,937 | 840 |
| PARTICULARS | Mar'15 | Mar'16 | Mar'17 | Mar'18 | Mar'19 | Mar'20 | Mar'21 | Mar'22 | Mar'23 | Mar'24 |
|---|---|---|---|---|---|---|---|---|---|---|
| Ratios | ||||||||||
| ROE (%) | -109.67 | -98.84 | -23.49 | -30.13 | -59.53 | -40.63 | -21.21 | -24.02 | -16.36 | -15.85 |
| ROCE (%) | -107.1 | -97.57 | -22.31 | -28.07 | -53.95 | -36.18 | -18.88 | -21.51 | -14.11 | -11.79 |
| Asset Turnover Ratio | 0.59 | 0.4 | 0.16 | 0.48 | 0.35 | 0.32 | 0.27 | 0.3 | 0.38 | 0.5 |
| PAT to CFO Conversion(x) | N/A | N/A | N/A | N/A | N/A | N/A | N/A | N/A | N/A | N/A |
| Working Capital Days | ||||||||||
| Receivable Days | 85 | 44 | 61 | 37 | 45 | 33 | 56 | 56 | 56 | 62 |
| Inventory Days | 0 | 0 | 0 | 0 | 0 | 0 | 0 | 0 | 0 | 0 |
| Payable Days | 0 | 0 | 0 | 0 | 0 | 0 | 0 | 0 | 0 | 0 |
One 97 Communications (Paytm) is India’s leading digital ecosystem for consumers and merchants as it has built the largest payments platform in India based on the number of consumers, number of merchants, number of transactions and revenue. It offered payment services, commerce and cloud services, and financial services to registered consumers and registered merchants. Its two-sided (consumer and merchant) ecosystem enables commerce, and provides access to financial services through its financial institution partners, by leveraging technology to improve the lives of its consumers and help its merchants grow their businesses.
The company launched Paytm in 2009, as a ‘mobile-first’ digital payments platform to enable cashless payments for Indians, giving them the power to make payments from their mobile phones. Starting with bill payments and mobile top-ups as the first use cases, and Paytm Wallet as the first Paytm Payment Instrument, it has built the largest payments platform in India based on the number of consumers, number of merchants, number of transactions and revenue as of March 31, 2021. Paytm is available across the country with ‘Paytm karo’ (i.e. use Paytm) evolving into a verb for hundreds of millions of Indian consumers, shopkeepers, merchants and small businesses.
The Paytm app is a payments-led super-app, through which it offer its consumers innovative and intuitive digital products and services. It offer its consumers a wide selection of payment options on the Paytm app, which include (i) Paytm Payment Instruments, which allow them to use digital wallets, sub-wallets, bank accounts, buy-now-pay-later and wealth management accounts and (ii) major third-party instruments, such as debit and credit cards and net banking. On its app, it enable its consumers to transact at in-store merchants, pay their bills, make mobile top-ups, transfer money digitally, create and manage their Paytm Payment Instruments, check linked account balances, service city challans and municipal payments, buy travel and entertainment tickets, play games online, access digital banking services, borrow money, buy insurance, make investments and more.
Business area of the company
The company is India's leading digital ecosystem for consumers as well as merchants.
Awards and Accreditations
Major events and milestones

MoneyWorks4Me rating and ranking of funds for SIP is available to subscribers only. Moneyworks4Me is not a rating and ranking agency, however it is required that users have a way of selecting funds and building a Portfolio. The method used by it are described below to enable users to understand the logic behind the rating and ranking Subscriber will find more details on this in the various content made available from time to time. In case you need more please write to besafe@moneyworks4Me.com
MoneyWorks4Me rates and ranks mutual funds based on the following data-driven system:
Funds ranking in screeners: Performance Consistency and Quality are two parameters used for ranking funds for SIP. The ranking as follows GG, GO, GR, OG, OO, OR, RG, RO and RR.
With the same color-coded funds, the one with the higher Average 3-year rolling returns (over 5 to 10 years), the number that appears in the Performance tag, ranks higher.
Here is the summary:
The third tag Upside Potential is not relevant for SIP. It is relevant for lumpsum investments in Mutual Funds.

Make an informed decision for Stocks
Invest using an intelligent system with powerful data-driven tools that help you identify opportunities and make informed buy-hold-sell decisions
Buy quality Stocks when they are available at reasonable prices and supported by an upward price trend and Sell when they are Overvalued using the Decizen Rating System. Covers 3500+ stocks

Account Discovery
- OTP from CAMS
Account Linking for Stocks & MF
- One OTP per link Eg. NSDL, CDSL, CAMS, KFin etc.
One Click Upload for your Current Portfolio and Future Transactions!

 Download APP


