Stocks - Q : Quality | V : Valuation | PT : Price Trend
Funds - P : Performance | Q : Quality
Funds - P : Performance | Q : Quality
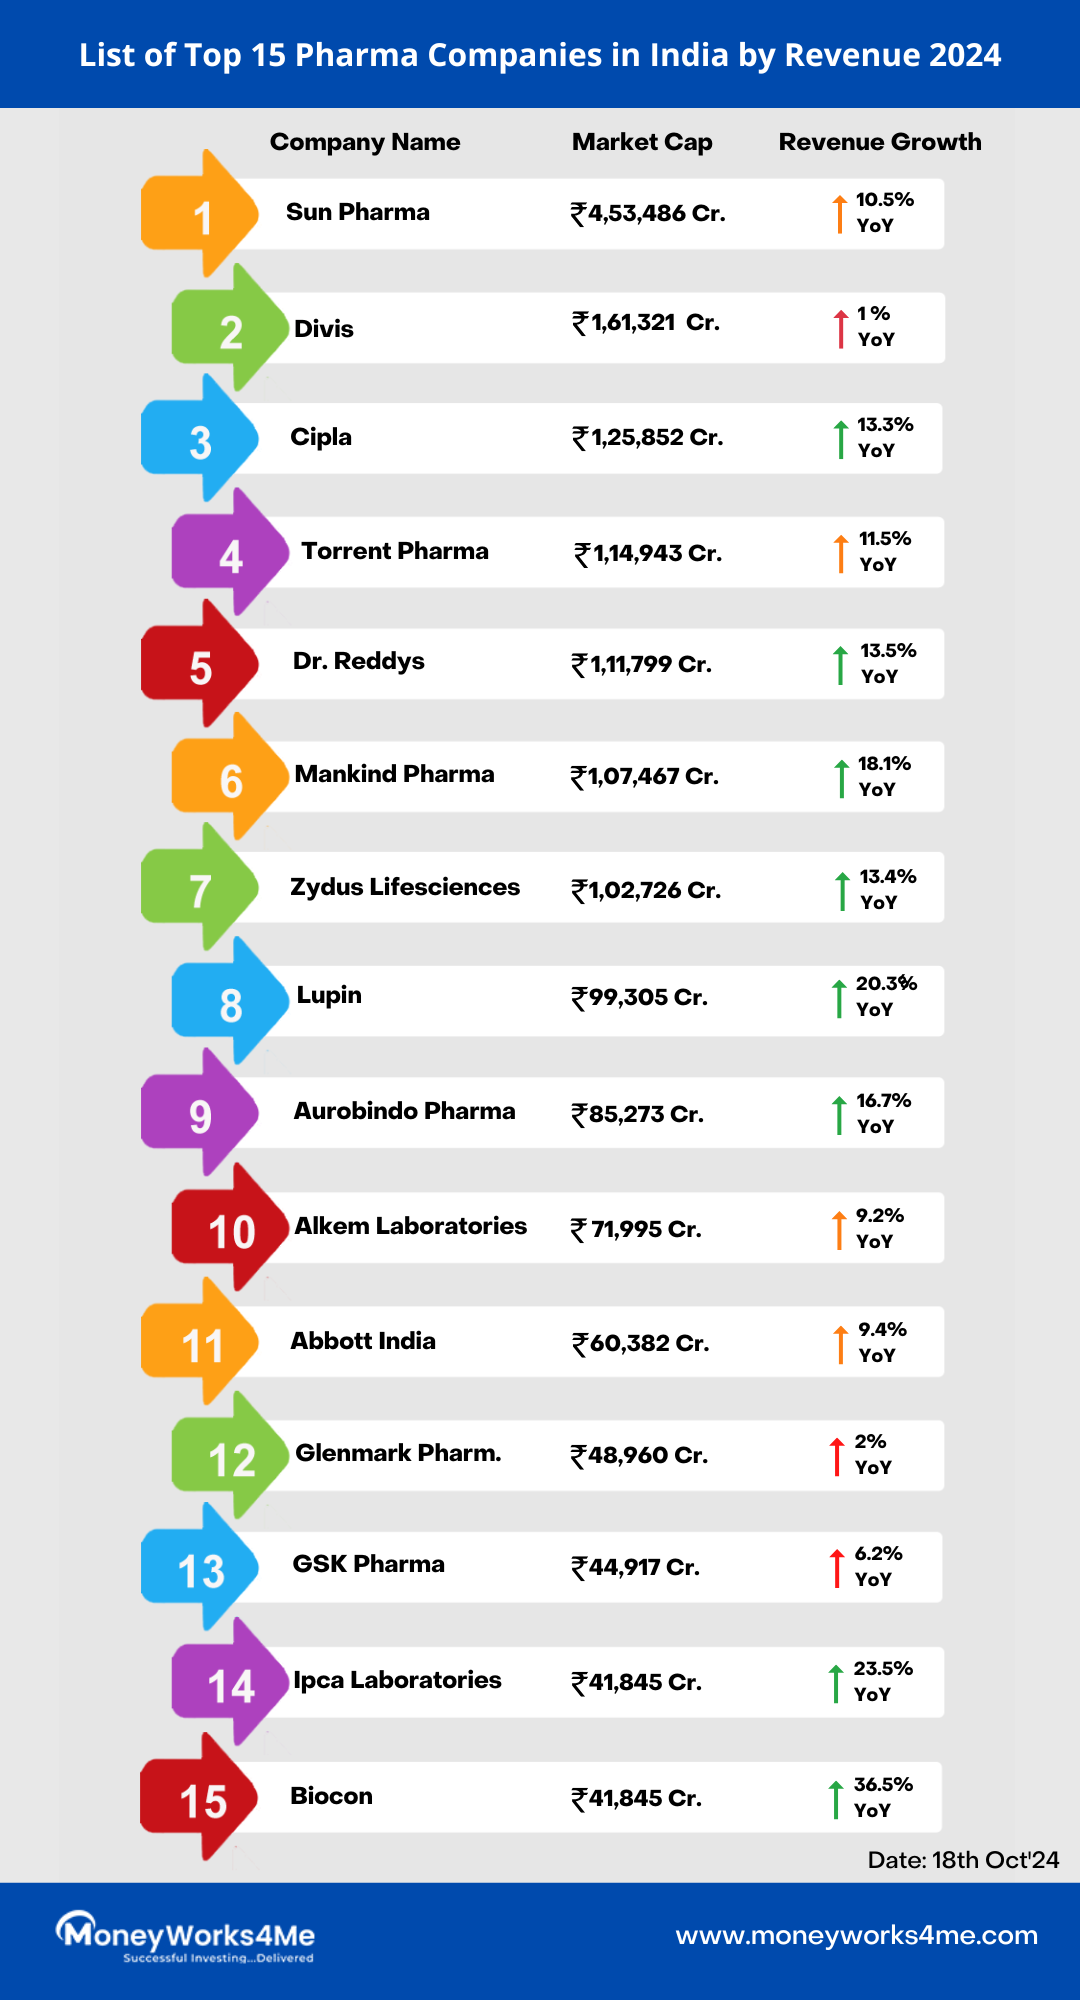
Top Pharma Companies in India as on Apr-2025
|| Company Name | CMP | Price Change(%) |
|---|---|---|
| 903.80 | 6.83% | |
| 2,906.55 | 4.26% | |
| 2,539.40 | 1.24% | |
| 674.05 | 1.04% | |
| 313.30 | 0.74% |
| Company Name | CMP | Price Change(%) |
|---|---|---|
| 12,300.60 | -5.99% | |
| 42.82 | -5.75% | |
| 1,087.70 | -5.59% | |
| 682.55 | -5.52% | |
| 58.82 | -5.43% |
 News about Top Pharma Companies in India
| Rank | Company | Market Capitalization 2025 (INR crores) |
|---|---|---|
| 1 | Sanofi Consumer Healthcare India Ltd. | 11,375 Crore |
| 2 | Astrazeneca Pharma India Ltd. | 21,821 Crore |
| 3 | Glaxosmithkline Pharmaceuticals Ltd. | 47,502 Crore |
| 4 | Sanofi India Ltd. | 14,460 Crore |
| 5 | Abbott India Ltd. | 63,212 Crore |
| 6 | Suven Pharmaceuticals Ltd. | 29,103 Crore |
| 7 | Vijaya Diagnostic Centre Ltd. | 10,650 Crore |
| 8 | Procter & Gamble Health Ltd. | 8,423 Crore |
| 9 | Torrent Pharmaceuticals Ltd. | 1,09,519 Crore |
| 10 | Gujarat Themis Biosyn Ltd. | 3,091 Crore |
Top Pharma Companies FAQs Source: NSE Indices
You can use different criterias to arrive at the list of best stocks in the Nifty Pharma company index. You can use return ratios like ROCE or ROE, that will help you choose companies with profitable growth.
Based on ROE, the best stocks in the Nifty Pharma companies index are:
| Company Name | Is it a Right Stock ? | CMP | Market Cap(Cr.) | P/E | P/BV | EV/EBITDA | ROE |
|---|---|---|---|---|---|---|---|
| Abbott India Ltd. (M) | Very Good | 29,748 | 63,212 | 47.37 | 16.28 | 33.10 | 34.87 |
| Natco Pharma Ltd. (S) | Very Good | 889.6 | 15,935 | 8.54 | 2.19 | 5.89 | 25.73 |
| Torrent Pharmaceuticals Ltd. (L) | Very Good | 3,236 | 1,09,519 | 58.82 | 13.68 | 30.02 | 24.28 |
| Ajanta Pharma Ltd. (S) | Very Good | 2,677 | 33,441 | 37.25 | 8.55 | 24.68 | 23.04 |
| Dr. Reddys Laboratories Ltd. (L) | Very Good | 1,174 | 97,928 | 18.23 | 3.05 | 10.96 | 21.33 |
Based on the past year's gain, the best performing stocks are:
| Company Name | Is it a Right Stock ? | CMP | Market Cap(Cr.) | Yearly gain (%) |
|---|---|---|---|---|
| Divis Laboratories Ltd. (L) | Very Good | 6,009 | 1,59,525 | 56.46 |
| Laurus Labs Ltd. (S) | Very Good | 625.4 | 33,725 | 47.05 |
| Lupin Ltd. (M) | Somewhat Good | 2,018 | 92,151 | 26.55 |
| Glenmark Pharmaceuticals Ltd. (M) | Somewhat Good | 1,359 | 38,348 | 25.88 |
| Ajanta Pharma Ltd. (S) | Very Good | 2,677 | 33,441 | 25.09 |
| View More |
Stocks with the highest revenue growth in the past 5 years is:
| Company Name | Is it a Right Stock ? | CMP | Market Cap(Cr.) | P/E | P/BV | EV/EBITDA | 5Y Sales Growth (%) |
|---|---|---|---|---|---|---|---|
| Mankind Pharma Ltd. (M) | Very Good | 2,552 | 1,05,276 | 53.79 | 7.41 | 35.34 | 19.33 |
| Laurus Labs Ltd. (S) | Very Good | 625.4 | 33,725 | 94.12 | 7.54 | 32.09 | 17.07 |
| JB Chemicals & Pharmaceuticals Ltd. (S) | Very Good | 1,576 | 24,536 | 39.03 | 7.40 | 24.10 | 17.05 |
| Ajanta Pharma Ltd. (S) | Very Good | 2,677 | 33,441 | 37.25 | 8.55 | 24.68 | 15.41 |
| Gland Pharma Ltd. (S) | Very Good | 1,451 | 23,912 | 21.33 | 2.53 | 12.63 | 15.31 |
Stocks with high profit growth often witness their stock prices gaining, irrespective of the market movements.
Stocks with the highest profit growth in the past 5 years is:
| Company Name | Is it a Right Stock ? | CMP | Market Cap(Cr.) | P/E | P/BV | EV/EBITDA | 5Y Profit Growth (%) |
|---|---|---|---|---|---|---|---|
| Lupin Ltd. (M) | Somewhat Good | 2,018 | 92,151 | 32.12 | 5.58 | 18.32 | 36.90 |
| Biocon Ltd. (M) | Somewhat Good | 312.0 | 37,459 | 62.21 | 3.26 | 102.5 | 31.80 |
| Mankind Pharma Ltd. (M) | Very Good | 2,552 | 1,05,276 | 53.79 | 7.41 | 35.34 | 29.77 |
| JB Chemicals & Pharmaceuticals Ltd. (S) | Very Good | 1,576 | 24,536 | 39.03 | 7.40 | 24.10 | 26.08 |
| Granules India Ltd. (S) | Very Good | 452.2 | 10,968 | 34.01 | 3.32 | 17.84 | 24.68 |

MoneyWorks4Me rating and ranking of funds for SIP is available to subscribers only. Moneyworks4Me is not a rating and ranking agency, however it is required that users have a way of selecting funds and building a Portfolio. The method used by it are described below to enable users to understand the logic behind the rating and ranking Subscriber will find more details on this in the various content made available from time to time. In case you need more please write to besafe@moneyworks4Me.com
MoneyWorks4Me rates and ranks mutual funds based on the following data-driven system:
Funds ranking in screeners: Performance Consistency and Quality are two parameters used for ranking funds for SIP. The ranking as follows GG, GO, GR, OG, OO, OR, RG, RO and RR.
With the same color-coded funds, the one with the higher Average 3-year rolling returns (over 5 to 10 years), the number that appears in the Performance tag, ranks higher.
Here is the summary:
The third tag Upside Potential is not relevant for SIP. It is relevant for lumpsum investments in Mutual Funds.

Make an informed decision for Stocks
Invest using an intelligent system with powerful data-driven tools that help you identify opportunities and make informed buy-hold-sell decisions
Buy quality Stocks when they are available at reasonable prices and supported by an upward price trend and Sell when they are Overvalued using the Decizen Rating System. Covers 3500+ stocks

Account Discovery
- OTP from CAMS
Account Linking for Stocks & MF
- One OTP per link Eg. NSDL, CDSL, CAMS, KFin etc.
One Click Upload for your Current Portfolio and Future Transactions!
 Download APP


