I see far too many people having far too many mutual funds in their portfolios. Their primary decision-making process is to look for the top-performing funds based on past returns and invest in them. No wonder they keep adding new ones and end up with so many. And despite the statutory warning that past performance is not a guarantee of future returns, it is how most people make decisions.
It’s apparent they are not investing effectively. And the main reason for this is that they don’t know a better way to make these decisions. This blog is an introduction to investing successfully in Mutual funds through a better decision-making process for SIP. And you will be able to implement it using the tools available on MoneyWorks4Me.
What is the most important thing to look for in an Equity Mutual Fund that will convince you, what is the sahi fund to SIP in?
It cannot be past returns simply because it keeps changing depending on the start and end date, and the period which you look at. And this depends on a heck of a lot on how the market performed in that period. For example, if you look at the past 3-year returns of any fund you will see great returns all above 25% and some way above it. The reason for this is that the market was down a lot from April 2020 till the end of 2020 due to the panic created by Covid. Nifty 50 Index Funds delivered higher than 25% returns over the same 3-year period.
This tells us two things, first you cannot look at absolute past returns and decide; you need to look at returns relative to its Benchmark Index. And second, you cannot look at returns in a fixed period because not only can it be misleading but also depends on when you SIP, you are investing your money at different times.
To explain what you should be looking at let’s say you SIP every month and you will hold this investment for atleast 3 years. Now, since no one can predict the future, you want a proper assessment of the fund’s track record that will enable you to make an informed decision. First, you want to know whether the fund delivered returns higher than its benchmark on every month’s SIP that was held for 3 years. And while every month’s SIP will have earned different returns what is the average returns that the fund delivered over a reasonably long period of time that covers the market and economic ups-and-downs or cycles? A fund with a solid track record on both is a fund that you can SIP in with a high level of confidence.
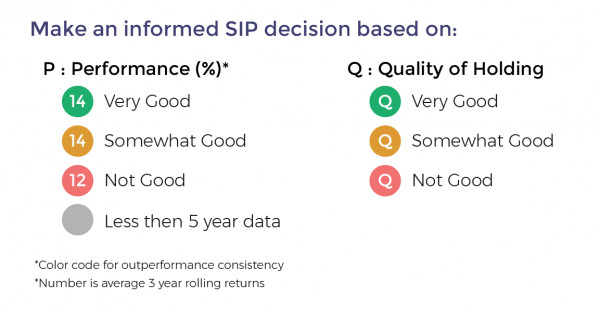
Moneyworks4me’s way of SIP in funds is captured in the first two FastTags or buttons that accompany every fund. The 1st FastTag on Performance gives the highest importance to the above and is explained below:
- Assessing Performance of a Fund: You will see this tag or button colored Green, Orange, Red, or Grey and a number inside it. The colour indicates how consistently the fund performed and beat its benchmark on a 3-year rolling basis as explained above i.e. its Outperformance Consistency. Funds are color-coded Green when they outperform their benchmark more than 90% of the time. Orange whey they outperform 80% to 90% of the time and Red if less than 80%. Funds with less than 5 years of data are color-coded Grey and have less than adequate data to assess outperformance consistency.The number inside the 1st FastTag is the Average 3-year Rolling Returns delivered by the fund, rolling one month. This reflects the average returns the fund has delivered in the past for a monthly SIP with a holding period of 3 years. Funds with the Grey performance button do not have a number as the period is inadequate to compute the average 3-year rolling returns that is representative.
- Quality of Portfolio Holding: Moneyworks4me has color-coded stocks as Green, Orange, and Red based on the company’s performance on ROCE and Free Cash Flows. Stocks that perform consistently on these combined metrics are color-coded Green, somewhat consistently as Orange, and inconsistent as Red.Funds are color-coded Green provided the portfolio has a 70% holding in Green stocks but not more than 20% in Red stocks. Funds with more than 20% Red stocks in the portfolio are color-coded Red. The rest are marked Orange.
Here is the summary:
When you see funds with Green on Performance you can be confident that the fund has consistently outperformed its benchmark index. When you have multiple funds that are Green -consistent outperformers, you can rank them based on their average 3-year rolling returns and select. Also preferably select a fund which is Green on quality.
You can see this on the Moneyworks4me Fund Screener. The default ranking for SIP is as follows: GG, GO, GR, OG, OO, OR, RG, RO, and RR. With the same color-coded funds, the one with the higher Average 3-year rolling returns, the number that appears in the Performance tag, ranks higher. Funds with Grey on Performance that have been operational for less than 5 years are listed below the funds that have been operational for longer.
Already have an account? Log in
Want complete access
to this story?
Register Now For Free!
Also get more expert insights, QVPT ratings of 3500+ stocks, Stocks
Screener and much more on Registering.


 Download APP


Comment Your Thoughts: