Stocks - Q : Quality | V : Valuation | PT : Price Trend
Funds - P : Performance | Q : Quality
Funds - P : Performance | Q : Quality
BSE: 533398 | NSE: MUTHOOTFIN | Finance - NBFC | Mid Cap


Past 10 year's financial track record analysis by Moneyworks4me indicates that Muthoot Finance Ltd is a good quality company.
The key valuation ratios of Muthoot Finance Ltd's currently when compared to its past seem to suggest it is in the Somewhat overvalued zone.
The Price Trend analysis by MoneyWorks4Me indicates it is Weak which suggest that the price of Muthoot Finance Ltd is likely to Fall in the short term. However, please check the rating on Quality and Valuation before investing.
Data adjusted to bonus, split, extra-ordinary income, rights issue and change in financial year end.
| Mar'15 | Mar'16 | Mar'17 | Mar'18 | Mar'19 | Mar'20 | Mar'21 | Mar'22 | Mar'23 | Mar'24 | TTM | ||
|---|---|---|---|---|---|---|---|---|---|---|---|---|
| Operating Income (₹ Cr.) | 4,314 | 4,861 | 5,729 | 6,267 | 6,878 | 8,715 | 10,557 | 11,082 | 10,515 | 12,635 | 15,542 | |
| YoY Gr. Rt. % | - | 12.7% | 17.8% | 9.4% | 9.8% | 26.7% | 21.1% | 5% | -5.1% | 20.2% | - | |
| Adj EPS (₹ ) | 16.9 | 20.3 | 29.5 | 44.4 | 49.2 | 75.3 | 92.8 | 98.5 | 86.5 | 100.9 | 118.3 | |
| YoY Gr. Rt. % | - | 20.4% | 45.5% | 50.5% | 10.8% | 52.9% | 23.3% | 6.2% | -12.2% | 16.6% | - | |
| BVPS (₹ ) | 127.2 | 140.3 | 162.6 | 194.8 | 244 | 288.2 | 379.6 | 456.9 | 524.6 | 605 | 672.6 | |
| YoY Gr. Rt. % | - | 10.3% | 15.9% | 19.8% | 25.2% | 18.1% | 31.7% | 20.4% | 14.8% | 15.3% | - | |
| To view Net Profit/Total Funds (%) Colour Rating Guide click here ⓘ | ||||||||||||
| Net Profit/Total Funds (%) | 2.5 | 3 | 4 | 5.7 | 5.7 | 6.8 | 6.5 | 5.9 | 4.9 | 5.1 | 0 | |
CAGR Colour Code Guide ⓘ
| 9 Years | 5 Years | 3 Years | 1 Years | |||||||||
|---|---|---|---|---|---|---|---|---|---|---|---|---|
| Net Interest Income | 12.7% | 12.9% | 6.2% | 20.2% | ||||||||
| Adj EPS | 22% | 15.4% | 2.8% | 16.6% | ||||||||
| BVPS | 18.9% | 19.9% | 16.8% | 15.3% | ||||||||
| Share Price | 27.3% | 23.5% | 17.1% | 27.7% | ||||||||
| RATIOS \ YEARS | Mar'15 | Mar'16 | Mar'17 | Mar'18 | Mar'19 | Mar'20 | Mar'21 | Mar'22 | Mar'23 | Mar'24 | TTM | |
|---|---|---|---|---|---|---|---|---|---|---|---|---|
| Asset Quality Ratio | To view Asset Quality Ratio Colour Rating Guide click here ⓘ | |||||||||||
| Net NPA to Net Advances (%) | 1.9 | 2.5 | 1.7 | 6.2 | 0.7 | 1.7 | 0 | 0 | 0 | 0 | - | |
| Capitalization Ratio | To view Capitalization Ratio Colour Rating Guide click here ⓘ | |||||||||||
| Capital Adequacy Ratio (%) | 24.8 | 24.5 | 24.9 | 26.6 | 26.1 | 25.5 | 0 | 0 | 0 | 0 | - | |
| Margins | ||||||||||||
| Net Profit Margin (%) | 15.5 | 16.7 | 20.6 | 28.4 | 28.7 | 34.6 | 35.3 | 35.7 | 33 | 32.1 | 30.6 | |
| Performance Ratios | To view Performance Ratios Colour Rating Guide click here ⓘ | |||||||||||
| Return on Equity (%) | 14.4 | 15.2 | 19.5 | 24.9 | 22.5 | 28.3 | 27.8 | 23.6 | 17.6 | 17.9 | 17.6 | |
Total Income has increased 6.17 CAGR in last 3 years
Net Profit has increased 2.83 CAGR in last 3 years
Total income growth is good in last 4 quarters
Return on Equity has declined versus last 3 years average to 18.50%
| Standalone | Consolidated | |
|---|---|---|
| TTM EPS (₹) | 118.3 | 123.6 |
| TTM Sales (₹ Cr.) | 15,542 | 18,429 |
| BVPS (₹.) ⓘ | 672.6 | 696.5 |
| Reserves (₹ Cr.) ⓘ | 26,600 | 27,560 |
| P/BV ⓘ | 3.14 | 3.03 |
| PE ⓘ | 17.84 | 17.07 |
| From the Market | |
|---|---|
| 52 Week Low / High (₹) | 1510.00 / 2444.65 |
| All Time Low / High (₹) | 73.60 / 2444.65 |
| Market Cap (₹ Cr.) | 84,747 |
| Equity (₹ Cr.) | 401.5 |
| Face Value (₹) | 10 |
| Industry PE ⓘ | 29.9 |
| Mar'24 | YoY Gr. Rt. % | Jun'24 | YoY Gr. Rt. % | Sep'24 | YoY Gr. Rt. % | Dec'24 | YoY Gr. Rt. % | |
|---|---|---|---|---|---|---|---|---|
| Operating Income | 3,382 | 19.4 | 3,677 | 23.5 | 4,089 | 34.7 | 4,394 | 39.9 |
| Adj EPS (₹) | 26.31 | 17 | 26.87 | 10.6 | 31.16 | 26.3 | 33.95 | 32.7 |
| Net Profit Mgn % | 30.99 | -64 bps | 29.12 | -340 bps | 30.39 | -200 bps | 30.82 | -161 bps |
| Pledged * | 0.00 | 0.00 | 0.00 | 0.00 | 0.00 | 0.00 | 0.00 | 0.00 | 0.00 | 0.00 |
Market Cap 45,037 Cr
CMP 1122
P/B 2.1xFY23
|
Results |
(INR Cr) |
YoY Growth |
Comments |
|
Advances |
52,730.3 |
3.78% |
Muted growth in gold loans |
|
Net Interest Income |
1595 |
-13.8% |
NIM declined by 242 bps, to 11.04% |
Key Highlights –
Management Outlook-
About the Industry: -
Non-banking finance companies (NBFCs) form a vital part of the Indian financial system. They help in taking credit to the unbanked segments of the society, driving financial inclusion and nation-building, complementing the banking sector. NBFCs enjoy the advantages of better product lines, lower cost, wider and effective reach, robust risk management capabilities to check and control bad debts and a better understanding of their customer segments vis-a -vis the traditional banks.
Till the middle of the last decade, the unorganised sector catered to India’s gold loan market with limited penetration of organised lenders. However, the gold loan industry is increasingly formalising now with established and organised players gaining market share. Traditionally known as a hyper retail local business, India’s gold loan market has started attracting large investors since last decade. India has seen the emergence of gold loan speciality players like Muthoot Finance and Manappuram Finance during this time.
With rural credit demand expected to rise, the gold loan market is likely to grown in lines with the same. With the organised gold loan penetration levels below 4%, there is headroom for growth in this market. Financial institutions with the right focus, operational capabilities, and availability of funds, refreshing products and modern technology are concentrating to capture a large market share and profitable returns.
About the Company: -
Muthoot Finance is the largest gold finance company in India in terms of loan portfolio. It provides business and personal loans secured by gold jewellery in rural/semi-urban areas to meet unanticipated requirement. Such loans are sought by individuals who possess gold jewellery but cannot access credit quickly, or no credit available due to lack of documentation.
Found in 1939 by Mr. George Muthoot, it received the NBFC licence in 2001 and got converted into a public limited company in 2008. As of September 2019, it had 4540 branches across India with 60% in south India. Today Muthoot Finance as a company pays royalty for using promoter’s name.
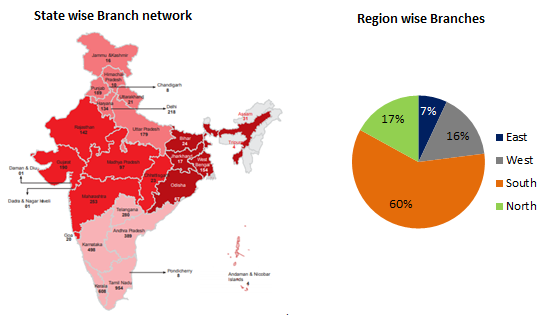
There has been increase in number of loans disbursements. The company processed 1,800 loans per branch as of FY19 vs ~1,500 in FY16.Following 11% decline in growth during the regulatory phase of FY12-FY14, the company’s strategic initiatives supported recovery to a 6% CAGR in loan accounts processed per branch and 8% CAGR in gold AUM per branch over FY15-FY19. This implies value growth over volume growth during this period.
The company has gross loan AUM of around 35,730 crores in Q2FY20 and growing at 9% CAGR from last 3 years. Increasing Gold prices over past year has led to increase in the AUM of Muthoot Finance. This is because, as the value of Gold (which is an underlying for the loan) increases, the borrower demands increase in his loan amount as well as new loans ticket size increases leading to more disbursement.
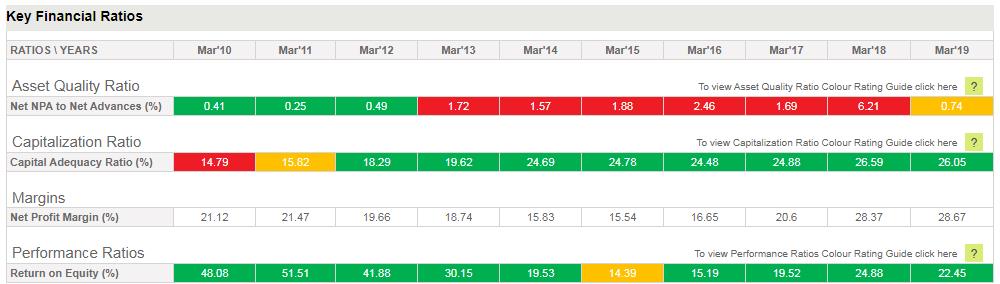
Muthoot Finance presence in hinterland lets him enjoy very high net interest margin ~15 and its ROE is as high as 22.4% in FY19 despite very low leverage ratio of 4%.
In terms of the loan portfolio of Muthoot Finance, 74% of the loans disbursed are below 6 month maturity. Lower the tenure of maturity, lower is the riskiness. Also 86% of the portfolio is below Rs. 2 lakhs. More granular (small size) loans ensure more safety in terms of defaults versus few big size loans.
What are the risks to business model?
Interest margins may face downward pressure as more financial companies enter smaller markets going forward.
The benefit of rising gold prices reverse when the gold prices fall. The fall in the value of gold increases the threat to the company of loan default. In such cases, the company maintains low loan-to-value. (Loan to value = Loan lent to value of underlying asset)
Another strategy used by the company to mitigate risk is maintaining High Churn Portfolio, which means disbursing loans of short term maturity (less than year). This protects the company against fluctuations against the gold prices over the period.
Gold finance has high cost of operations as it has branch spread equal to large banks like HDFC Bank/Axis Bank despite having AUM size of less than 1/10th size. The need to maintain safety vaults, quick disbursement and granular loans are reasons for large branch spread. Cost to income ratio has increased to 37% in Q2 FY20 from 21% in Q2FY19 versus cost to income ratio of some other NBFCs ranging from 10%-20%.
Muthoot Finance business model is very simple as it lends against gold and grow with more people pledging gold. There may not be a single household that doesn’t possess gold and when a poor family faces adversity, they fall back on this asset by pledging it for loan requirement. However, there are some negatives like high operating costs, risk of default in case of falling gold prices, risk from pricing pressure with more financial inclusion.
We believe that the company will continue to deliver good volume growth but growth in loan/NIM will depend on gold prices as well. Currently due to rising gold prices, the growth is very good. We expect it to come down over time. Current prices do not provide margin of safety we will await for better levels to buy the stock.
Muthoot Finance : Stock rises after our Sell Call
On 28th May we had shared on Muthoot Finance advising SELL on the stock at 208-210/share.
We cited the following reason for Selling the stock:
“We continue to believe that the competition from new banking licenses and increase branch reach of traditional banks will hurt high net interest margins of Muthoot Finance. In our channel checks, we found that pricing pressure are rising across regions and this can hurt high ROE of Muthoot Finance as it operates on high cost model. We do not expect the return on equity to increase beyond 14-16% in longer term as well. In that case, value creation for shareholders would be quite low.
Hence, in our opinion, we should exit the stock at this price (~Rs. 208-210/share). The stock may go up in future but we don’t see a big opportunity in this business. Including dividends, we have earned 6.6% return on Muthoot Finance.
Note: We expect the markets to be volatile in this financial year. We would get many good businesses at bargain prices.”
However, post our sell call the stock has appreciated by 40%. In hindsight it looks like a mistake. Let us explain our logic.
We invest in companies for a fundamental reason. If we believe fundamentally the company can earn higher returns on capital, we commit our capital to the company. This has generated returns for long periods of time irrespective of market sentiment and will work in future too.
Coming to Muthoot Finance, we have seen a broad thematic rally in all rural and financial plays for last 1-3 months. There is no logic behind 20%+ rally in each of these stocks but sheer momentum due to buoyancy about good monsoon this year. We do not see business earnings growing by 20%+ in matter of months. Ultimately, the stock price is slave of earnings and moves in line with earnings growth.

While we do accept that we left few money on the table but believe us that this rally is purely speculative and luck.
We would have not known this in advance that this rally is likely. Imagine what if the stock price would have gone downwards by more than 20-30%. We believe that the pain of loss is worse than pain of lost gain. We first wish to protect the risk and then look out for returns.
We are constantly monitoring more stocks in small cap space and expect to add another 2-3 stocks which have strong underlying fundamentals.
A portfolio must be held for the long term, which we define as at least 5-7 years. However, this does not mean every stock will perform in each year. Our performance should be judged on the basis of the overall portfolio over 2-3 years at least, not on the basis of short-term performance of individual stocks.
We had generated BUY on Muthoot Finance in March 2015 at price of Rs. 200/share.
Refer to our Note on September 2015. We had highlighted that we see this opportunity has low risk and minimum downside. We insisted to hold even after correction.
“We consider this as very low risk opportunity, with no downside in valuation. We advise you to hold the stock despite recent correction. Quarterly results in Oct’15 and Jan’16 are likely to drive the stock price to its valuation. Please ensure that the stock doesn’t form more than 3% of your portfolio.”
In the same note, we had highlighted that there are some concerns pertaining to business model of Muthoot Finance.
“We believe these new banking licenses to microfinance institutions will have an edge over pure NBFCs like Muthoot Finance due to access to low cost CASA deposits and scalable equity base. However, we strongly believe that bank conversion process is tedious and takes longer due to various regulatory requirements like higher capital adequacy ratio, higher provisioning, etc. Also, it will take longer for these small microfinance banks to increase their foothold (branches) to acquire low cost CASA deposits”
We continue to believe that the competition from new banking licenses and increase branch reach of traditional banks will hurt high net interest margins of Muthoot Finance. In our channel checks, we found that pricing pressure are rising across regions and this can hurt high ROE of Muthoot Finance as it operates on high cost model. We do not expect the return on equity to increase beyond 14-16% in longer term as well. In that case, value creation for shareholders would be quite low.
Hence, in our opinion, we should exit the stock at this price (~Rs. 208-210/share). The stock may go up in future but we don’t see a big opportunity in this business. Including dividends, we have earned 6.6% return on Muthoot Finance.
Note: We expect the markets to be volatile in this financial year. We would get many good businesses at bargain prices.
Markets do experience cyclicality always. It’s always better to have some cash when markets are overvalued. This reduces our downside when markets correct, additionally this cash can be used to average or invest in our best stock ideas. This helps us generate good returns in long term.
Since our recommendation, the stock has corrected around 23%-25%. There is no reason as such why the stock has been correcting. We have followed a very low risk strategy by allocating just 3% of our portfolio.
We believe market is anticipating lower rural income due to deficit rainfall this season, as negative for the company’s loan book growth. However, we do not foresee stress on balance sheet as the company highly liquid asset as collateral and conservative loan to value ratio of ~69%. This safeguards the company from any distress.
Additionally, we had highlighted in our previous note (Mar’15 & Jul’15), in pursuit of financial inclusion RBI may issue bank licenses to institutions in rural areas. This was sighted as a concern for the company to grow its loan book and high return on equity.
We believe these new banking licenses to microfinance institutions will have an edge over pure NBFCs like Muthoot Finance due to access to low cost CASA deposits and scalable equity base. However, we strongly believe that bank conversion process is tedious and takes longer due to various regulatory requirements like higher capital adequacy ratio, higher provisioning, etc. Also, it will take longer for these small microfinance banks to increase their foothold (branches) to acquire low cost CASA deposits.
Meanwhile, Muthoot Finance will have an advantage to expand its book with the help of its 4200 branches and existing presence in rural areas. To understand the magnitude of this number, HDFC Bank (leading bank in retail lending) has close to 4000 branches & third largest bank by asset size, Bank of Baroda has close to 4200 branches. This gives us comfort that Muthoot Finance will be able to maintain its loan book size and increase it marginally every year.
We are expecting close to 12% growth rate in loan book, a very conservative number. We expect return on equity of more than 15-16% which gives us comfort that book value of the company would increase at the rate of 13-14% at 20% dividend payout. Even at these conservative estimates and multiple of 1.5x we get valuation of Rs. 243/share one year hence. We consider this as very low risk opportunity, with no downside in valuation. We advise you to hold the stock despite recent correction. Quarterly results in Oct’15 and Jan’16 are likely to drive the stock price to its valuation. Please ensure that the stock doesn’t form more than 3% of your portfolio.
| Company Name | CMP(₹) | |||||||
|---|---|---|---|---|---|---|---|---|
| Aditya Birla Capital | 197.7 | 1.8 (0.9%) | Mid Cap | 34,506 | 14.2 | 10 | 13.8 | 1.7 |
| SBI Cards AndPayment | 906.8 | 18.4 (2.1%) | Mid Cap | 16,968 | 21.5 | 14.2 | 41.3 | 6.3 |
| Mah & Mah Finl. Serv | 275.3 | 2.7 (1%) | Mid Cap | 15,797 | 20 | 12.3 | 13.6 | 1.6 |
| L&T Finance | 163.5 | 4.9 (3.1%) | Mid Cap | 13,581 | 10.3 | 17.1 | 15.5 | 1.6 |
| Muthoot Finance | 2,111 | 31.1 (1.5%) | Mid Cap | 12,635 | 118.3 | 32.1 | 17.6 | 3.1 |
| Sundaram Finance | 5,237.9 | 55.9 (1.1%) | Mid Cap | 7,267 | 143.5 | 19.6 | 36.1 | 4.4 |
| Indian Ren. Energy | 173.4 | -3.1 (-1.7%) | Mid Cap | 4,964 | 6.3 | 25.2 | 27.9 | 4.6 |
| Poonawalla Fincorp | 385.1 | 1.4 (0.4%) | Mid Cap | 3,114 | 2.2 | 66 | 174.5 | 3.7 |
| Tata Invest Corp | 6,291.3 | 33.4 (0.5%) | Mid Cap | 288 | 55.9 | 83.7 | 112.1 | 0.9 |
| PARTICULARS | Mar'15 | Mar'16 | Mar'17 | Mar'18 | Mar'19 | Mar'20 | Mar'21 | Mar'22 | Mar'23 | Mar'24 |
|---|---|---|---|---|---|---|---|---|---|---|
| Income | 4,325 | 4,875 | 5,747 | 6,333 | 6,881 | 8,723 | 10,574 | 11,098 | 10,544 | 12,694 |
| Interest Income | 4,314 | 4,861 | 5,729 | 6,267 | 6,878 | 8,715 | 10,557 | 11,082 | 10,515 | 12,635 |
| Other Income ⓘ | 11 | 14 | 18 | 67 | 2 | 8 | 17 | 16 | 29 | 59 |
| Expenditure ⓘ | 3,297 | 3,558 | 3,826 | 3,488 | 3,804 | 4,665 | 5,568 | 5,789 | 5,877 | 7,245 |
| Interest Expense ⓘ | 2,108 | 2,260 | 2,298 | 1,935 | 2,243 | 2,796 | 3,699 | 3,845 | 3,709 | 4,667 |
| Operating Expenses ⓘ | 1,143 | 1,122 | 1,231 | 1,287 | 1,496 | 1,692 | 1,685 | 1,734 | 2,010 | 2,280 |
| Provisions | 46 | 177 | 297 | 267 | 65 | 177 | 184 | 211 | 158 | 299 |
| Exceptional Items ⓘ | 0 | 0 | 0 | 0 | 0 | 0 | 0 | 0 | 0 | 0 |
| Profit Before Tax ⓘ | 1,028 | 1,317 | 1,921 | 2,845 | 3,077 | 4,057 | 5,007 | 5,309 | 4,666 | 5,449 |
| Taxes ⓘ | 357 | 507 | 741 | 1,067 | 1,105 | 1,039 | 1,284 | 1,355 | 1,193 | 1,399 |
| Profit After Tax | 671 | 810 | 1,180 | 1,778 | 1,972 | 3,018 | 3,722 | 3,954 | 3,474 | 4,050 |
| Adjusted EPS (₹) | 16.9 | 20.3 | 29.5 | 44.4 | 49.2 | 75.3 | 92.8 | 98.5 | 86.5 | 100.9 |
| Dividend Payout Ratio (%) | 36% | 30% | 20% | 23% | 24% | 20% | 22% | 20% | 25% | 24% |
| PARTICULARS | Mar'15 | Mar'16 | Mar'17 | Mar'18 | Mar'19 | Mar'20 | Mar'21 | Mar'22 | Mar'23 | Mar'24 |
|---|---|---|---|---|---|---|---|---|---|---|
Equity and Liabilities | ||||||||||
| Equity Capital | 5,084 | 5,619 | 6,516 | 7,812 | 9,793 | 11,572 | 15,239 | 18,345 | 21,062 | 24,290 |
| Share Capital ⓘ | 398 | 399 | 399 | 400 | 401 | 401 | 401 | 401 | 401 | 401 |
| Reserves ⓘ | 4,686 | 5,220 | 6,117 | 7,412 | 9,392 | 11,171 | 14,838 | 17,943 | 20,660 | 23,889 |
| Minority Interest | 0 | 0 | 0 | 0 | 0 | 0 | 0 | 0 | 0 | 0 |
| Long Term Borrowings | 7,886 | 6,351 | 4,848 | 7,656 | 9,700 | 13,214 | 21,436 | 27,733 | 30,398 | 38,770 |
| Current Liabilities | 14,118 | 15,386 | 19,991 | 15,317 | 18,559 | 25,674 | 26,761 | 24,428 | 21,120 | 21,935 |
| Trade Payables | 51 | 61 | 111 | 124 | 163 | 218 | 202 | 151 | 180 | 204 |
| Short term borrowings | 7,761 | 8,364 | 12,755 | 13,800 | 17,147 | 23,958 | 24,522 | 22,066 | 19,346 | 20,028 |
| Other Liabilities | -7,812 | -8,425 | -12,866 | -13,924 | -17,311 | -24,176 | -24,723 | -22,217 | -19,525 | -20,232 |
| Total Liabilities ⓘ | 27,088 | 27,356 | 31,355 | 30,786 | 38,051 | 50,460 | 63,436 | 70,506 | 72,580 | 84,996 |
Assets | ||||||||||
| Non Current Asset | 401 | 426 | 541 | 704 | 1,304 | 1,399 | 1,504 | 1,764 | 1,792 | 2,870 |
| Loan Asset | 0 | 0 | 12 | 0 | 0 | 0 | 0 | 0 | 0 | 0 |
| Other Non Current Asset ⓘ | 401 | 426 | 529 | 704 | 1,304 | 1,399 | 1,504 | 1,764 | 1,792 | 2,870 |
| Current Asset | 26,687 | 26,930 | 30,814 | 30,082 | 36,747 | 49,061 | 61,932 | 68,742 | 70,788 | 82,126 |
| Current Investment | 0 | 0 | 0 | 1 | 0 | 407 | 523 | 4 | 5 | 3 |
| Other Current Asset | 26,687 | 26,930 | 30,814 | 30,081 | 36,747 | 48,654 | 61,409 | 68,738 | 70,783 | 82,123 |
| Total Assets ⓘ | 27,088 | 27,356 | 31,355 | 30,786 | 38,051 | 50,460 | 63,436 | 70,506 | 72,580 | 84,996 |
| PARTICULARS | Mar'15 | Mar'16 | Mar'17 | Mar'18 | Mar'19 | Mar'20 | Mar'21 | Mar'22 | Mar'23 | Mar'24 |
|---|---|---|---|---|---|---|---|---|---|---|
| Cash Flow From Operating Activity ⓘ | -460 | 214 | -1,710 | -87 | -3,858 | -4,458 | -7,477 | -1,142 | -1,902 | -9,302 |
| Cash Flow From Investing Activity ⓘ | -16 | -67 | -134 | -194 | -585 | -429 | 48 | 408 | 188 | -739 |
| Cash Flow From Financing Activity ⓘ | 254 | -1,204 | 2,457 | -554 | 5,701 | 8,678 | 9,041 | 2,796 | -1,036 | 8,649 |
| Net Cash Flow ⓘ | -222 | -1,058 | 613 | -834 | 1,258 | 3,791 | 1,612 | 2,062 | -2,750 | -1,392 |
| PARTICULARS | Mar'15 | Mar'16 | Mar'17 | Mar'18 | Mar'19 | Mar'20 | Mar'21 | Mar'22 | Mar'23 | Mar'24 |
|---|---|---|---|---|---|---|---|---|---|---|
Operational & Financial Ratios |
||||||||||
| EPS (₹) | 17 | 20 | 30 | 44 | 49 | 75 | 93 | 99 | 87 | 101 |
| DPS (₹) | 6 | 6 | 6 | 10 | 12 | 15 | 20 | 20 | 22 | 24 |
| BVPS (₹) | 127 | 140 | 163 | 195 | 244 | 288 | 380 | 457 | 525 | 605 |
Performance Ratios | ||||||||||
| ROA (%) | 2.5 | 3.0 | 4.0 | 5.7 | 5.7 | 6.8 | 6.5 | 5.9 | 4.9 | 5.1 |
| ROE (%) | 14.4 | 15.2 | 19.5 | 24.9 | 22.5 | 28.3 | 27.8 | 23.6 | 17.6 | 17.9 |
| ROCE (%) | 13.0 | 14.7 | 16.3 | 16.9 | 16.2 | 16.1 | 15.8 | 14.2 | 12.1 | 13.2 |
Valuation Parameters | ||||||||||
| Price/Book(x) | 1.6 | 1.3 | 2.3 | 2.1 | 2.5 | 2.1 | 3.2 | 2.9 | 1.9 | 2.4 |
Muthoot Finance Limited was incorporated as a private limited Company on March 14, 1997 and was converted into a public limited Company on November 18, 2008. The Company is promoted by Mr. M. G. George Muthoot, Mr. George Thomas Muthoot, Mr. George Jacob Muthoot and Mr. George Alexander Muthoot collectively operating under the brand name of ‘The Muthoot Group’, which has diversified interests in the fields of Financial Services, Healthcare, Education, Plantations, Real Estate, Foreign Exchange, Information Technology, Insurance Distribution, Hospitality etc. The Company obtained permission from the Reserve Bank of India for carrying on the business of Non-Banking Financial Institutions on 13-11-2001. The Company is presently classified as Systemically Important Non-Deposit Taking NBFC (NBFC-ND-SI).
Business area of the company
Muthoot Finance is a non-banking financial company (NBFC), which is engaged in providing loan (financing) against collateral of gold jewelry. The company offers gold loans, foreign inward money transfer services, foreign exchange services, insurance broking etc.
Services offered by the company
Awards
Milestones

MoneyWorks4Me rating and ranking of funds for SIP is available to subscribers only. Moneyworks4Me is not a rating and ranking agency, however it is required that users have a way of selecting funds and building a Portfolio. The method used by it are described below to enable users to understand the logic behind the rating and ranking Subscriber will find more details on this in the various content made available from time to time. In case you need more please write to besafe@moneyworks4Me.com
MoneyWorks4Me rates and ranks mutual funds based on the following data-driven system:
Funds ranking in screeners: Performance Consistency and Quality are two parameters used for ranking funds for SIP. The ranking as follows GG, GO, GR, OG, OO, OR, RG, RO and RR.
With the same color-coded funds, the one with the higher Average 3-year rolling returns (over 5 to 10 years), the number that appears in the Performance tag, ranks higher.
Here is the summary:
The third tag Upside Potential is not relevant for SIP. It is relevant for lumpsum investments in Mutual Funds.

Make an informed decision for Stocks
Invest using an intelligent system with powerful data-driven tools that help you identify opportunities and make informed buy-hold-sell decisions
Buy quality Stocks when they are available at reasonable prices and supported by an upward price trend and Sell when they are Overvalued using the Decizen Rating System. Covers 3500+ stocks

Account Discovery
- OTP from CAMS
Account Linking for Stocks & MF
- One OTP per link Eg. NSDL, CDSL, CAMS, KFin etc.
One Click Upload for your Current Portfolio and Future Transactions!


 Download APP


