Stocks - Q : Quality | V : Valuation | PT : Price Trend
Funds - P : Performance | Q : Quality
Funds - P : Performance | Q : Quality
BSE: 539056 | NSE: IMAGICAA | Amusement Parks/Recreation/Club | Small Cap

Past 10 year's financial track record analysis by Moneyworks4me indicates that Imagicaaworld Entertainment Ltd is a average quality company.
The key valuation ratios of Imagicaaworld Entertainment Ltd's currently when compared to its past seem to suggest it is in the Somewhat overvalued zone.
The Price Trend analysis by MoneyWorks4Me indicates it is Semi Strong which suggest that the price of Imagicaaworld Entertainment Ltd is likely to Rise-somewhat in the short term. However, please check the rating on Quality and Valuation before investing.
Data adjusted to bonus, split, extra-ordinary income, rights issue and change in financial year end.
Value Creation Index Colour Code Guide ⓘ
| Mar'15 | Mar'16 | Mar'17 | Mar'18 | Mar'19 | Mar'20 | Mar'21 | Mar'22 | Mar'23 | Mar'24 | TTM | |
|---|---|---|---|---|---|---|---|---|---|---|---|
| ROCE % ⓘ | -3.1% | -2.5% | -2.1% | -1.9% | -3.8% | -26.7% | -17.9% | -16.6% | 34% | 52.2% | - |
| Value Creation Index ⓘ | -1.2 | -1.2 | -1.2 | -1.1 | -1.3 | NA | NA | NA | 1.4 | 2.7 | - |
Growth Parameters ⓘGrowth Parameters Colour Code Guide ⓘ | |||||||||||
| Sales ⓘ | 189 | 234 | 239 | 236 | 240 | 200 | 22 | 72 | 251 | 260 | 369 |
| Sales YoY Gr. | - | 23.5% | 2.2% | -1.2% | 1.7% | -16.8% | -89% | 228.1% | 247.8% | 3.8% | - |
| Adj EPS ⓘ | -13.5 | -13.4 | -14.8 | -17.8 | -39.5 | -42.6 | -32.3 | -27.8 | 8.6 | 3.6 | 1.2 |
| YoY Gr. | - | NA | NA | NA | NA | NA | NA | NA | NA | -57.6% | - |
| BVPS (₹) ⓘ | 88.8 | 75.6 | 60.8 | 44.4 | 5.3 | -39.9 | -70.3 | -97.5 | 5.7 | 16.5 | 22.1 |
| Adj Net Profit ⓘ | -108 | -107 | -119 | -157 | -348 | -375 | -284 | -246 | 353 | 175 | 67 |
| Cash Flow from Ops. ⓘ | 33.9 | 57.3 | 84.5 | 37.8 | 48.3 | 21.8 | 4.1 | 4.5 | 117 | 106 | - |
| Debt/CF from Ops. ⓘ | 34.6 | 17.6 | 12.6 | 28.4 | 22.2 | 49.4 | 262.5 | 240.5 | 6.9 | 2.4 | - |
CAGR Colour Code Guide ⓘ
| 9 Years | 5 Years | 3 Years | 1 Years | |||||
|---|---|---|---|---|---|---|---|---|
| Sales ⓘ | 3.6% | 1.6% | 127.9% | 3.8% | ||||
| Adj EPS ⓘ | NA | NA | NA | -57.6% | ||||
| BVPSⓘ | -17.1% | 25.6% | NA | 190.7% | ||||
| Share Price | -7.1% | 76% | 60.2% | -21.4% | ||||
Performance Ratio Colour Code Guide ⓘ
| Mar'15 | Mar'16 | Mar'17 | Mar'18 | Mar'19 | Mar'20 | Mar'21 | Mar'22 | Mar'23 | Mar'24 | TTM | |
|---|---|---|---|---|---|---|---|---|---|---|---|
| Return on Equity % ⓘ | -15.3 | -16.2 | -21.7 | -35.6 | -157.8 | 246.4 | 58.6 | 33.3 | -112.9 | 34.1 | 6.2 |
| Op. Profit Mgn % ⓘ | 10.8 | 17 | 25.4 | 26.5 | 19.5 | 13.9 | -150 | 44.9 | 34 | 37.1 | 40.7 |
| Net Profit Mgn % ⓘ | -57.1 | -45.6 | -49.6 | -66.3 | -144.7 | -187.6 | -1294.4 | -341.5 | 141.1 | 67.5 | 18.2 |
| Debt to Equity ⓘ | 1.7 | 1.7 | 2.2 | 2.8 | 23.1 | -3.1 | -1.7 | -1.3 | 3.5 | 0.3 | - |
| Working Cap Days ⓘ | 0 | 163 | 216 | 226 | 233 | 237 | 1,817 | 619 | 128 | 60 | 133 |
| Cash Conv. Cycle ⓘ | 0 | 59 | 128 | 136 | 147 | 171 | 1,367 | 439 | -23 | -12 | -162 |
Return on Equity has increased versus last 3 years average to 6.20%
Sales growth is growing at healthy rate in last 3 years 127.92%
Debt to equity has declined versus last 3 years average to 0.32
Sales growth is good in last 4 quarters at 31.95%
Net Profit has been subdued in last 3 years 0.00%
| Standalone | Consolidated | |
|---|---|---|
| TTM EPS (₹) | 1.2 | 1.2 |
| TTM Sales (₹ Cr.) | 369 | 369 |
| BVPS (₹.) ⓘ | 22.1 | 22.1 |
| Reserves (₹ Cr.) ⓘ | 687 | 686 |
| P/BV ⓘ | 2.95 | 2.95 |
| PE ⓘ | 54.71 | 54.71 |
| From the Market | |
|---|---|
| 52 Week Low / High (₹) | 57.01 / 103.24 |
| All Time Low / High (₹) | 1.82 / 207.05 |
| Market Cap (₹ Cr.) | 3,698 |
| Equity (₹ Cr.) | 565.8 |
| Face Value (₹) | 10 |
| Industry PE ⓘ | 42 |
| Mar'24 | YoY Gr. Rt. % | Jun'24 | YoY Gr. Rt. % | Sep'24 | YoY Gr. Rt. % | Dec'24 | YoY Gr. Rt. % | |
|---|---|---|---|---|---|---|---|---|
| Sales (₹ Cr.)ⓘ | 56.6 | 5.1 | 181 | 80 | 40 | 11.5 | 91.9 | 31.2 |
| Adj EPS (₹) ⓘ | 0.2 | -96 | 1.3 | -68.7 | -0.1 | N/A | 0.1 | -70.6 |
| Op. Profit Mgn % ⓘ | 30.44 | 360 bps | 59.29 | 947 bps | -9.46 | -2140 bps | 32.24 | -725 bps |
| Net Profit Mgn % ⓘ | 15.35 | -33013 bps | 37.76 | -15566 bps | -17.10 | 5639 bps | 3.24 | -840 bps |
| Pledged * | 5.62 | 0.00 | 0.00 | 0.00 | 0.00 | 0.00 | 0.00 | 0.00 | 0.00 | 0.00 |
Say ‘NO’ to ride with Adlabs Entertainment Ltd!
Adlabs Entertainment Ltd
Details of the offer
Price Band has been fixed at Rs. 221-230 and the issue is opening on March 10 and will close on March 12.
Offer Objective
Through the fresh issue the company proposes to collect between Rs 448 cr and Rs 467 cr by issue of 20 lakh shares of which, Rs 330 cr is to be used for partial repayment of the consortium. The balance proceeds net of issue expenses is earmarked for general corporate purpose.
About the Company
Adlabs Entertainment Limited (Adlabs), Rs. 1650 Cr company, is promoted by Mr Manmohan Shetty, and owns and operates two theme parks (Adlabs Mumbai) on the Mumbai-Pune expressway, namely, Imagica Theme Park (Imagica) and Aquamagica Water Nation (Aquamagica). The company also owns a hotel managed by Novotel which is expected to start operations in March, 2015. Imagica has 25 rides and attractions while Aquamagica houses 14 water slides and wave pools. It is the first large format theme park in India covering over 110 acres.
What Should Investors do?
In entertainment industry location plays a key role in generating the revenues. Imagica is strategically located between Mumbai & Pune which gives it good opportunity to attract people hangout in Lonavala & Khandala. Della Adventure, a similar hangout nearby attracts good number of visitors for the same reason. Given the high capacity of Adlabs Imagica, 15,000 per hour, we believe it will be very attractive destination for weekend holidays, corporate and school trips. In expectations of lucrative prospects, the company has already incurred capacity layout of Rs. 1650 Cr in total, with debt funding of close to Rs. 1,150 Cr.
The company earns ~70% of its revenues from ticket sales and rest from food & beverages and parking. The revenues are seasonal in nature, wherein there are high footfalls in summer vacation of schools & colleges. Coming to cost structure, due to high initial capital outlay with help of debt financing, interest cost along with depreciation form major part of its overall cost structure. In addition to that, employee cost & power cost form fixed part of cost structure. The business by nature has high operating leverage, wherein the increase in revenues beyond fixed cost flows to earnings directly, which can be distributed to the shareholders. Key metric to judge the value of the company is to estimate increase in footfalls & ticket size (i.e. Revenues). The management is trying to attract customers on regular basis by way of creating a holiday resort with Accord's Novotel Hotel in Imagica campus. The company doesn’t have a proven track record in entertainment & resorts. The success highly depends on how the brand attracts new customers and earns their loyalty.
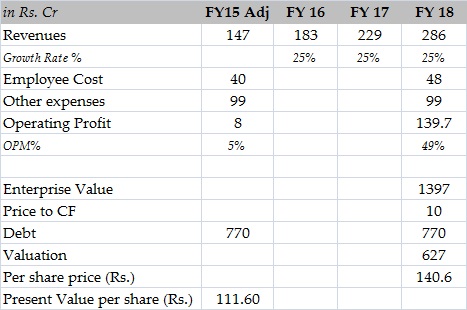
Considering very optimistic scenario wherein the revenues will grow at 25% CAGR for next three years and report an operating margin of 50%, we get Enterprise Value of Rs. 1397 or ten times three year hence cash flow. This gives around market value of equity of ~Rs. 627 Cr or Rs. 140 per share at the end of third year. Actual value per share today comes at Rs. 90-111 per share.
We believe that due to bullish market sentiments, the IPO may list at much higher price multiple and jump on the first day of trading. However, we feel that at the price band of Rs. 221-230 the stock is highly overvalued and has no upside based on valuation. Being fundamental analysts, we do not recommend subscribing to this IPO.
Estimates:
| Company Name | CMP(₹) | |||||||
|---|---|---|---|---|---|---|---|---|
| Wonderla Holidays | 697.4 | -11.1 (-1.6%) | Small Cap | 483 | 19.1 | 32.7 | 37.2 | 2.6 |
| Imagicaaworld Enter | 65.4 | -3.8 (-5.5%) | Small Cap | 260 | 1.2 | 67.5 | 57.9 | 3.1 |
| Nicco Parks & Resort | 119.8 | -4.9 (-3.9%) | Small Cap | 79.3 | 3.8 | 26.3 | 32.6 | 7 |
| Hanman Fit | 6.1 | 0.4 (7.6%) | Small Cap | 0.2 | 0.6 | 126 | 9 | 2.4 |
| Northland Holding Co | - | 0 (0%) | Small Cap | 0 | - | - | - | - |
| Sun City Amusement | - | 0 (0%) | Small Cap | 0 | - | - | - | - |
| Apex Buildsys | - | 0 (0%) | Small Cap | 0 | - | - | - | - |
| PARTICULARS | Mar'15 | Mar'16 | Mar'17 | Mar'18 | Mar'19 | Mar'20 | Mar'21 | Mar'22 | Mar'23 | Mar'24 |
|---|---|---|---|---|---|---|---|---|---|---|
| Sales | 189 | 234 | 239 | 236 | 240 | 200 | 22 | 72 | 251 | 260 |
| Operating Expenses ⓘ | 169 | 194 | 178 | 174 | 193 | 204 | 57 | 40 | 166 | 164 |
| Manufacturing Costs | 19 | 18 | 18 | 22 | 21 | 21 | 9 | 14 | 24 | 34 |
| Material Costs | 16 | 25 | 24 | 26 | 24 | 22 | 3 | -24 | 28 | 29 |
| Employee Cost | 48 | 60 | 56 | 49 | 54 | 52 | 28 | 25 | 45 | 50 |
| Other Costs ⓘ | 86 | 92 | 81 | 77 | 94 | 109 | 17 | 26 | 69 | 51 |
| Operating Profit ⓘ | 20 | 40 | 61 | 62 | 47 | -4 | -35 | 32 | 85 | 96 |
| Operating Profit Margin (%) | 10.8% | 17.0% | 25.4% | 26.4% | 19.5% | -1.9% | -158.0% | 44.9% | 33.9% | 37.0% |
| Other Income ⓘ | 2 | 5 | 1 | 1 | 6 | 1 | 25 | 3 | 83 | 18 |
| Interest ⓘ | 115 | 111 | 121 | 128 | 134 | 152 | 163 | 188 | 53 | 2 |
| Depreciation ⓘ | 80 | 88 | 95 | 93 | 102 | 243 | 96 | 91 | -51 | 79 |
| Exceptional Items ⓘ | 0 | 0 | 0 | 0 | 0 | 0 | 0 | 0 | -5 | 509 |
| Profit Before Tax ⓘ | -172 | -154 | -154 | -156 | -182 | -397 | -269 | -244 | 161 | 543 |
| Tax ⓘ | -65 | -50 | -36 | 0 | 165 | 0 | 0 | 0 | -196 | 2 |
| Profit After Tax | -107 | -104 | -118 | -156 | -348 | -397 | -269 | -244 | 357 | 541 |
| PAT Margin (%) | -56.6% | -44.4% | -49.5% | -66.1% | -144.0% | -198.0% | -1,223.4% | -338.0% | 142.5% | 208.0% |
| Adjusted EPS (₹) | -13.4 | -13.0 | -14.8 | -17.8 | -39.5 | -45.1 | -30.5 | -27.6 | 8.7 | 11.2 |
| Dividend Payout Ratio (%) | 0% | 0% | 0% | 0% | 0% | 0% | 0% | 0% | 0% | 0% |
| PARTICULARS | Mar'15 | Mar'16 | Mar'17 | Mar'18 | Mar'19 | Mar'20 | Mar'21 | Mar'22 | Mar'23 | Mar'24 |
|---|---|---|---|---|---|---|---|---|---|---|
Equity and Liabilities | ||||||||||
| Shareholders Fund | 709 | 604 | 486 | 391 | 47 | -351 | -619 | -862 | 233 | 794 |
| Share Capital ⓘ | 80 | 80 | 80 | 88 | 88 | 88 | 88 | 88 | 412 | 482 |
| Reserves ⓘ | 629 | 524 | 406 | 303 | -42 | -439 | -707 | -951 | -178 | 312 |
| Minority Interest | 0 | 0 | 0 | 0 | 0 | 0 | 0 | 0 | 0 | 0 |
| Debt | 1,123 | 1,003 | 1,048 | 975 | 1,073 | 1,076 | 1,078 | 1,078 | 806 | 252 |
| Long Term Debt | 1,039 | 957 | 987 | 891 | 0 | 0 | 0 | 0 | 213 | 0 |
| Short Term Debt | 84 | 46 | 61 | 84 | 1,073 | 1,076 | 1,078 | 1,078 | 592 | 252 |
| Trade Payables | 28 | 32 | 31 | 28 | 27 | 22 | 32 | 25 | 23 | 24 |
| Others Liabilities ⓘ | 70 | -88 | -94 | 9 | 156 | 281 | 444 | 632 | -151 | -166 |
| Total Liabilities ⓘ | 1,931 | 1,551 | 1,471 | 1,403 | 1,302 | 1,029 | 935 | 873 | 911 | 904 |
Fixed Assets | ||||||||||
| Gross Block | 1,459 | 1,525 | 1,530 | 1,543 | 1,635 | 1,647 | 1,649 | 1,650 | 1,654 | 1,623 |
| Accumulated Depreciation | 115 | 202 | 297 | 387 | 489 | 731 | 827 | 918 | 866 | 946 |
| Net Fixed Assetsⓘ | 1,344 | 1,322 | 1,233 | 1,156 | 1,146 | 916 | 822 | 731 | 788 | 677 |
| CWIP ⓘ | 131 | 61 | 95 | 87 | 3 | 0 | 0 | 0 | 11 | 54 |
| Investmentsⓘ | 1 | 0 | 0 | 0 | 0 | 0 | 0 | 0 | 6 | 10 |
| Inventories | 15 | 111 | 113 | 115 | 116 | 84 | 82 | 114 | 15 | 16 |
| Trade Receivables | 6 | 4 | 4 | 5 | 9 | 5 | 2 | 3 | 5 | 4 |
| Cash Equivalents | 394 | 20 | 7 | 3 | 2 | 3 | 4 | 6 | 65 | 106 |
| Others Assetsⓘ | 41 | 32 | 19 | 37 | 24 | 21 | 25 | 18 | 21 | 36 |
| Total Assets ⓘ | 1,931 | 1,551 | 1,471 | 1,403 | 1,302 | 1,029 | 935 | 873 | 911 | 904 |
| PARTICULARS | Mar'15 | Mar'16 | Mar'17 | Mar'18 | Mar'19 | Mar'20 | Mar'21 | Mar'22 | Mar'23 | Mar'24 |
|---|---|---|---|---|---|---|---|---|---|---|
| Cash Flow From Operating Activity ⓘ | 34 | 57 | 85 | 38 | 48 | 22 | 4 | 4 | 117 | 106 |
| PBT ⓘ | -172 | -142 | -154 | -156 | -182 | -397 | -269 | -244 | 161 | 543 |
| Adjustment ⓘ | 194 | 186 | 215 | 218 | 236 | 425 | 260 | 249 | -56 | -437 |
| Changes in Working Capital ⓘ | 12 | 15 | 25 | -23 | -4 | -9 | 12 | -1 | 12 | 1 |
| Tax Paid ⓘ | 0 | -1 | -1 | -1 | -1 | 2 | 1 | 1 | -1 | -1 |
| Cash Flow From Investing Activity ⓘ | -137 | -85 | -43 | 4 | -8 | -10 | -2 | 0 | -9 | -64 |
| Capex | -142 | -89 | -44 | 4 | -9 | -10 | -2 | -1 | -17 | -64 |
| Net Investments | 3 | 3 | 1 | 0 | 0 | 0 | 0 | 0 | -3 | -1 |
| Others ⓘ | 2 | 1 | 0 | 0 | 0 | 0 | 0 | 0 | 12 | 1 |
| Cash Flow From Financing Activityⓘ | 465 | -343 | -53 | -46 | -41 | -11 | -2 | -1 | -53 | -2 |
| Net Proceeds from Shares ⓘ | 388 | 0 | 0 | 65 | 0 | 0 | 0 | 0 | 418 | 0 |
| Net Proceeds from Borrowing ⓘ | 144 | -133 | 42 | -13 | 0 | 0 | 0 | 0 | 0 | 0 |
| Interest Paid ⓘ | -125 | -115 | -110 | -120 | -39 | -11 | -2 | -2 | -19 | -2 |
| Dividend Paid ⓘ | 0 | 0 | 0 | 0 | 0 | 0 | 0 | 0 | 0 | 0 |
| Others ⓘ | 58 | -95 | 15 | 22 | -2 | 0 | 0 | 0 | -451 | -1 |
| Net Cash Flow ⓘ | 362 | -371 | -11 | -4 | -1 | 0 | 1 | 3 | 55 | 39 |
| PARTICULARS | Mar'15 | Mar'16 | Mar'17 | Mar'18 | Mar'19 | Mar'20 | Mar'21 | Mar'22 | Mar'23 | Mar'24 |
|---|---|---|---|---|---|---|---|---|---|---|
| Ratios | ||||||||||
| ROE (%) | -15.13 | -15.81 | -21.7 | -35.63 | -158.88 | N/A | N/A | N/A | 0 | 105.3 |
| ROCE (%) | -3.06 | -2.5 | -2.12 | -1.91 | -3.75 | N/A | N/A | N/A | 33.99 | 52.18 |
| Asset Turnover Ratio | 0.1 | 0.13 | 0.16 | 0.16 | 0.18 | 0.17 | 0.02 | 0.08 | 0.28 | 0.29 |
| PAT to CFO Conversion(x) | N/A | N/A | N/A | N/A | N/A | N/A | N/A | N/A | 0.33 | 0.2 |
| Working Capital Days | ||||||||||
| Receivable Days | 11 | 8 | 6 | 7 | 11 | 13 | 57 | 14 | 6 | 6 |
| Inventory Days | 29 | 98 | 171 | 176 | 176 | 183 | 1,381 | 498 | 94 | 22 |
| Payable Days | 644 | 442 | 472 | 412 | 412 | 417 | 3,527 | -431 | 317 | 298 |

MoneyWorks4Me rating and ranking of funds for SIP is available to subscribers only. Moneyworks4Me is not a rating and ranking agency, however it is required that users have a way of selecting funds and building a Portfolio. The method used by it are described below to enable users to understand the logic behind the rating and ranking Subscriber will find more details on this in the various content made available from time to time. In case you need more please write to besafe@moneyworks4Me.com
MoneyWorks4Me rates and ranks mutual funds based on the following data-driven system:
Funds ranking in screeners: Performance Consistency and Quality are two parameters used for ranking funds for SIP. The ranking as follows GG, GO, GR, OG, OO, OR, RG, RO and RR.
With the same color-coded funds, the one with the higher Average 3-year rolling returns (over 5 to 10 years), the number that appears in the Performance tag, ranks higher.
Here is the summary:
The third tag Upside Potential is not relevant for SIP. It is relevant for lumpsum investments in Mutual Funds.

Make an informed decision for Stocks
Invest using an intelligent system with powerful data-driven tools that help you identify opportunities and make informed buy-hold-sell decisions
Buy quality Stocks when they are available at reasonable prices and supported by an upward price trend and Sell when they are Overvalued using the Decizen Rating System. Covers 3500+ stocks

Account Discovery
- OTP from CAMS
Account Linking for Stocks & MF
- One OTP per link Eg. NSDL, CDSL, CAMS, KFin etc.
One Click Upload for your Current Portfolio and Future Transactions!

 Download APP


