Anshul Saigal is a seasoned investment professional and a key figure in the Indian asset management industry. He has served as the Portfolio Manager and Head of Portfolio Management Services at Kotak Mahindra Asset Management Company. With over two decades of experience in capital markets, he has built a consistent track record of delivering market-beating portfolio returns. Saigal is deeply passionate about financial markets and continuously seeks to expand his knowledge by studying the works of investment luminaries like Ben Graham, Charlie Munger, Warren Buffett, and George Soros. He has a particular interest in behavioural finance and incorporates its principles into his approach to portfolio management.
In his presentation, ‘Anatomy of a Mispriced Stock’ delivered to CFA Society India, discusses the kinds of opportunities that lead to outsized returns with limited risks. This blog will be divided into two parts. Part 1 of this blog will introduce the concept of stocks as fractional business ownerships, with an emphasis on identifying and analyzing mispriced opportunities. Part 2 of this blog discusses the myth of cheap valuations, the quality premium, reasons for mispricing and how investors can profit from mispriced opportunities.
Let’s dive into Part 1!
What is a Stock?
Stocks are fractional ownerships in businesses. They are not tickers that go up or down with the mood of Mr. Market. – Benjamin Graham
This statement is commonly heard but rarely understood. Most people focus on the opposite; they concentrate on stock price movements more than on the quality and changes in the underlying business.
Case Study: The LBO of Patni Computers (Buying real estate worth a crore only to find that the previous owner left a crore in cash inside the property)
From mid-2007, prior to the Lehman Crisis, to February 2009, at the bottom of the ensuing bear market, the stock price of Patni Computers fell by more than 80%, from around Rs. 550 to below Rs. 100, with a market capitalization of approximately Rs. 2,400 crores. However, the company had cash and equivalents of over Rs. 2,000 crores and an Operating Profit of Rs. 500 crores.
The attractiveness of the investment opportunity can be analyzed through the lens of a Leveraged Buyout (LBO). With an operating cash flow of Rs. 450 crores and an interest coverage ratio of 1.2 times, the company had the ability to pay Rs.375 crores of debt annually. At a 10% interest rate, the debt capacity of the company is Rs. 3,750 crores. Assuming the LBO Special Purpose Vehicle (SPV) requires equity capital of 10% of the debt, the total capital amounts to Rs. 4,125 crores.

On merging the SPV with Patni Computers, debt worth Rs. 2,000 crores can be repaid on the first day, with the remaining debt cleared over the next 5-6 years. Additionally, the company will have a Rs. 450 crore cash flow stream available from the 7th year onwards with just Rs. 375 crores of invested equity capital. In summary, the company is worth significantly more than its market capitalization and may be worth even more than the LBO valuation, as the return on invested capital would be extremely high. In this case, the stock appreciated by nearly 5 times by the end of 2009.
Viewing a business as a cash-generating entity, rather than a mere ticker, allows an investor to focus on the important aspects of the business rather than the direction of stock price movements. Only investors who view investments as fractional ownerships of businesses can take advantage of such mispriced bets in the market, where the risk-reward ratio is extremely favorable.
What are Mispriced Bets?
To us, investing is the equivalent of going out and betting against a pari-mutuel system. We look for a horse with one chance in two of winning which pays you three to one. You’re looking for a mispriced bet. That’s what investing is. And you have to know enough to know whether the bet is mispriced. – Charlie Munger
Horse Racing
“There is no such thing as LIKING a horse to win a race, only an attractive discrepancy between his chances and his price.” – Steven Crist

In a 3-horse race with a betting pool of Rs. 35,000, Horse 3 has the highest payout ratio because its chances of winning are expected to be 14%. However, once in a while, Horse 3 will be lighter, better suited for the conditions, and well-rested, making the actual chances of winning around 20%. This creates a value bet.
While other players focus on identifying the most likely winner and setting a price according to that standard, a value investor’s goal is not to identify the winner but to find where the odds of winning are higher than the betting odds. While a bettor may not win every time they place such a bet, a series of such bets would definitely generate a profit over time.
Curious Two Years in Century Ply’s Long Life
In April 2020, Century Plyboards (India) posed a dilemma: whether to sell or hold. Anshul Saigal’s funds had begun purchasing stock in Century Plyboards at the end of 2019, with an average purchase price of about Rs. 160. As Covid struck, the stock price fell to Rs. 110. The question at hand was whether the company’s fundamentals had deteriorated, justifying the price, or whether the stock was merely reacting to market sentiments.
A reverse DCF could easily determine whether the market’s expectations were low, high, or fair at the prevailing prices. As the calculation showed, the market expected the company to grow sales at 5% for the next 10 years, at a sustainable margin of 13%, with no growth anticipated thereafter. In reality, the business had historically maintained EBITDA margins of between 15% and 18%. The current margins of 13% to 14% were simply extrapolated into the future, with little regard for historic performance.
Additionally, the macroeconomic outlook was quite optimistic. Ten crore households were expected to become capable of home ownership over the next 10 years, of which 1.7 crore were in the upper- and middle-income categories. Assuming 17 lakh upper- and middle-income households purchased a house annually, the total cost of construction would amount to Rs. 17 lakh crore per year, assuming a construction cost of Rs. 1 crore per house. Further assuming plywood costs at 10% of the total construction cost, the plywood market size would be Rs. 170,000 crores per year, with the organised market making up roughly 50% of that, at Rs. 85,000 crores per year. In FY20, Century Plyboards held a 10-15% market share and had a revenue of approximately Rs. 2,000 crores. In summary, the price reflected extremely pessimistic expectations.
April 2020

Source: Bloomberg
By March 2022, almost two years later, the stock price had risen nearly sevenfold to Rs. 700, reflecting a 12% sales growth for the next 10 years, sustainable EBITDA margins of 19%, and a terminal growth rate of 6.5%.
March 2022

Source: Bloomberg
Clearly, at this level, the prices reflected high levels of optimism, leaving little room for error. Consequently, the fund trimmed its position.
The case study illustrates that investing is not inherently complex; it can, in fact, be quite straightforward. In this instance, proof by contradiction demonstrated that the market’s initial expectations were excessively pessimistic. Macroeconomic data pointed to a strong growth trajectory for the next 10 years, positioning Century Plyboards as a significant beneficiary. Moreover, the price at the time included terminal growth as an optionality. Such pessimistic expectations were bound to correct, leading to a substantial rise in the stock price, as eventually happened. However, at the higher valuations, proof by contradiction suggested that the expectations had become unfavourable.
While the example may suggest that investing is simple, it is anything but. Making such investments requires dissociating from the present, understanding the underlying business, and evaluating expectations—none of which is easy. Maintaining conviction when all hell breaks loose is particularly challenging.
Investing is tough.
Asian Paints and APL Apollo Tubes

Source: Bloomberg
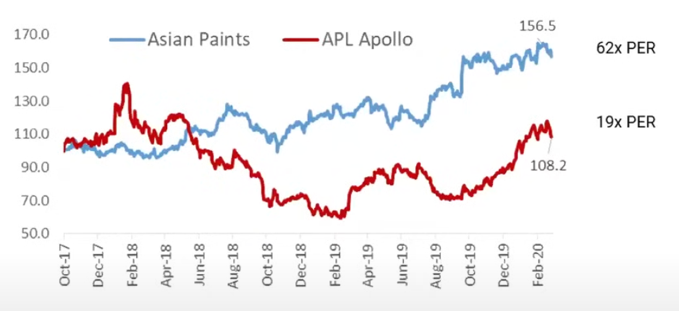
Between 2017 and 2020, APL Apollo outperformed Asian Paints across all metrics. The former had a higher 5-year average return on equity and a faster compounded earnings growth rate. All indications pointed towards APL Apollo performing better than Asian Paints. However, reality turned out to be the exact opposite.
Between October 2017 and February 2020, before Covid, APL Apollo’s stock price remained flat, while Asian Paints delivered a nearly 56% return. Additionally, APL Apollo’s stock price fell by around 40-45% during the interim, creating significant angst for clients. The fact that the company was growing faster, had a high return on equity, and was relatively cheaper did little to reassure them.
Source: Bloomberg
If one has conviction, can dissociate the business from the stock price, and follows the right process with patience, it pays off eventually.

Source: Bloomberg
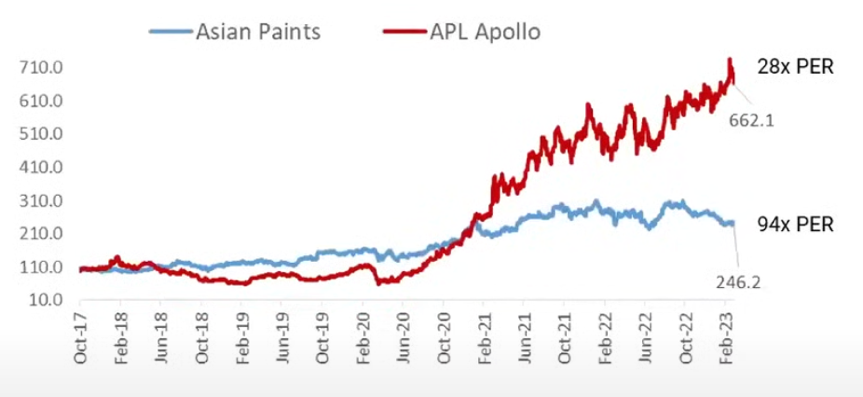
Post-Covid, Asian Paints’ earnings grew in the low single digits, while APL Apollo’s earnings grew at extremely high rates. Eventually, this growth was reflected in the stock price. Over the nearly 5-year period, Asian Paints outperformed for nearly half the duration, but ultimately, APL Apollo delivered outsized returns of nearly sevenfold.
Source: Bloomberg
Ultimately, process & patience pays.
To continue exploring this topic and dive deeper into our insights, don’t miss out on Part 2 of our blog. Click here to access it now!
Already have an account? Log in
Want complete access
to this story?
Register Now For Free!
Also get more expert insights, QVPT ratings of 3500+ stocks, Stocks
Screener and much more on Registering.


 Download APP





Comment Your Thoughts: