Anshul Saigal is a seasoned investment professional and a key figure in the Indian asset management industry. He has served as the Portfolio Manager and Head of Portfolio Management Services at Kotak Mahindra Asset Management Company. With over two decades of experience in capital markets, he has built a consistent track record of delivering market-beating portfolio returns. Saigal is deeply passionate about financial markets and continuously seeks to expand his knowledge by studying the works of investment luminaries like Ben Graham, Charlie Munger, Warren Buffett, and George Soros. He has a particular interest in behavioural finance and incorporates its principles into his approach to portfolio management.
In his presentation, ‘Anatomy of a Mispriced Stock’ delivered to CFA Society India, discusses the kinds of opportunities that lead to outsized returns with limited risks. This blog will be divided into two parts. Part 1 of this blog will introduce the concept of stocks as fractional business ownerships, with an emphasis on identifying and analyzing mispriced opportunities. Part 2 of this blog discusses the myth of cheap valuations, the quality premium, reasons for mispricing and how investors can profit from mispriced opportunities.
Let’s dive into Part 2!
Is Mispricing = Cheap Valuations ~ Myth or Reality?
In general, cheaper valuations are more attractive than expensive valuations, primarily due to implied expectations. Cheap stocks have low expectations, meaning they tend to fall little when expectations are not met and rise significantly when those low expectations are exceeded. On the other hand, expensive stocks carry high expectations and have a lot of room for failure. They may not rise proportionately, even with strong results, for the same reason.
However, not all seemingly expensive stocks are truly expensive, and not all seemingly cheap stocks are genuinely cheap. Quality becomes the key discriminating factor. Some companies will continue to underperform even the most modest expectations, while others can exceed high expectations.
The Mumbai Real Estate Metaphor
For those unfamiliar with Mumbai’s real estate market, the price per square foot generally increases as one moves southward and westward.

Source: 99 Acres
A common mistake made by many value investors is attempting to purchase Malabar Hill properties at Mira Bhayandar prices. They perceive the high absolute price of Malabar Hill properties as too high relative to general property prices, failing to account for quality. Such trades may only be possible during periods of extreme market chaos and high uncertainty, but these situations are rare.
Similarly, high-quality stocks will seldom be available at low-quality valuations. However, bargains may still exist for those who recognize that quality deserves a premium. A Malabar Hill property available at Worli prices is a bargain. Likewise, the relative valuation for high-quality stocks differs from that for low-quality stocks.
Cheapness must be measured relative to quality, not in absolute terms.
ROIC: The Marker of Quality in Equity Markets
ROIC is a calculation used to assess a company’s efficiency in allocating capital to profitable investments.
The Impact of ROIC
In this example, both companies reinvest 10% of their invested capital each year for growth. In the case of Company A, which has a 6% ROIC, the company’s cash balance keeps reducing as it grows. In contrast, Company B, with an 18% ROIC, continues to generate increasing amounts of cash as it grows. Over time, Company A’s financial position weakens as it consumes more cash than it produces, while Company B compounds its profits at an attractive rate and generates free cash flow.
Therefore, Company B is significantly more valuable than Company A.
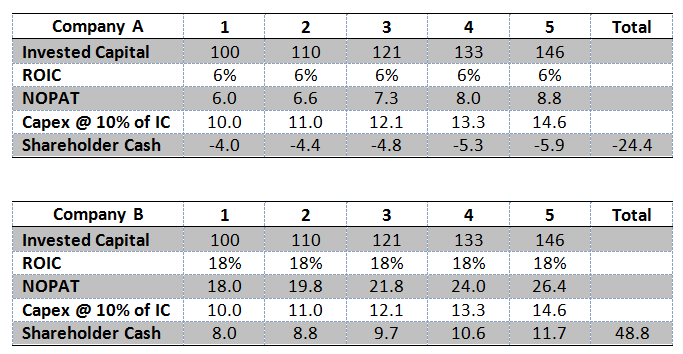
As this example illustrates, a consistently high ROIC reflects a higher quality business and typically indicates strong competitive advantages. Such high-quality businesses tend to have valuations that differ substantially from those of lower-quality businesses, but this divergence in valuation is well justified.
To quote Charlie Munger, “Over the long term, it’s hard for a stock to earn a much better return than the business which underlies it earns. If the business earns 6% on capital over 40 years and you hold it for that 40 years, you’re not going to make much different than a 6% return even if you originally buy it at a huge discount. Conversely, if a business earns 18% on capital over 20 or 30 years, even if you pay an expensive-looking price, you’ll end up one hell of a result.”
Types of Mispricing
Mispricings can be classified into two types: Environment-Centric and Business-Centric. Environment-centric mispricings arise due to factors outside the company’s control, such as market collapses, sectoral headwinds, and regulatory changes. On the other hand, business-centric mispricings are caused by factors directly attributable to the company, such as temporary earnings declines, management uncertainty, unfavorable news, or liquidity issues.
Such uncertainties create or lead to an expectation of a decline in earnings growth. Analysts who focus on current earnings tend to sell the stocks of such businesses. However, when short-term impacts on earnings do not indicate permanent deterioration in earnings power, lower stock prices present opportunities for discerning investors.
Earnings power refers to a company’s ability to generate profits and is forward-looking. It focuses not on current earnings but rather on the company’s capacity to earn in the future. As earnings grow over time and align with the company’s true earnings power, mispricings correct themselves, leading to significant returns for investors. Earnings growth drives returns, and discrepancies between current earnings and earnings power represent opportunities for growth-driven investments.
Earnings power emanates from several factors, including moats and entry barriers, growth and the ability to self-finance that growth, skin in the game of owner-operators, strong corporate culture, and good governance. These characteristics ensure that the ability of a good business to generate earnings remains intact. The earnings power of a good business typically does not diminish. Market values, which are beyond anyone’s control, may decline, but earnings power rarely does.
Case Study - Public Sector Banks
Public sector banks (PSBs) in India have long been associated with poor capital allocation, resulting in a steady loss of market share to private banks. Despite their operational inefficiencies, even these underperforming businesses have traded at disproportionately low valuations during certain periods, presenting opportunities for contrarian investors.
By FY18, the Gross Non-Performing Loans (GNPLs) of PSBs reached an alarming 14.6%, a crisis triggered by a government-led cleanup drive following the introduction of the Insolvency and Bankruptcy Code (IBC) in 2016. This cleanup forced bad assets out of the system, marking a turning point for the sector. From the FY18 peak, GNPLs began to decline, improving profitability and return on equity (ROE) for PSBs.

By mid-2020, during the COVID-19 pandemic, PSB stocks were trading at an astonishing 0.3x their book value, even though losses had largely bottomed out. Investors remained averse to the space due to the recency bias of the GNPL crisis. However, valuations at these levels presented a significant risk-reward asymmetry. Years of scrutiny by the Reserve Bank of India (RBI) had strengthened PSBs, and the likelihood of new asset-quality issues was minimal.
Post-pandemic, the re-rating of PSBs was swift. By May 2024, the PSU Bank Index rebounded to a Price-to-Book (P/B) multiple of 1.3x, driven by improved profitability and investor sentiment. This re-rating allowed astute investors to generate substantial returns.
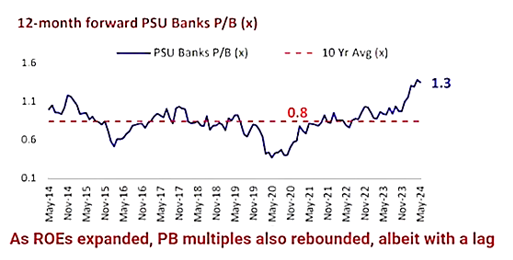
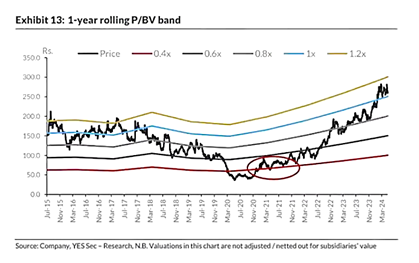
One standout opportunity was the Bank of Baroda. In 2021, it traded at just 0.4x its book value, compared to 1.2x in 2015. Despite having assets of Rs. 7 lakh crore—over three times those of Kotak Mahindra Bank—it was valued at only one-tenth of Kotak’s market capitalization. This massive undervaluation presented a clear disconnect. Between FY21 and FY24, Bank of Baroda’s profitability surged, with PAT increasing from Rs. 1,620 crore to Rs. 18,000 crore. Its stock price has since risen over 3x from June 2021 levels. Investors who focused on the bank's earnings power rather than its temporary earnings weakness were able to capitalize on this turnaround.
Case Study - Tips Industries (2023)
At the time of investment in 2023, Tips owned a catalog of over 30,000 songs in multiple languages and genres, offering a diverse collection of music content. The company licensed these songs to various platforms, including OTT platforms, content aggregators, and TV channels. Unlike global markets, where audio streaming was largely driven by paid subscriptions, the Indian market primarily relied on free subscribers. The average realization per user was approximately 10 paise, with paid subscriptions offering a potential increase of 3-4 times that amount.
Several growth drivers positioned Tips for continued success at the time. These included favorable industry tailwinds, the strength and relevance of its content, competitive positioning, strategic acquisition of new content, and technological advancements such as the transition from 3G to 5G. Additional opportunities were emerging from short-format content monetization and collaborations with platforms like Meta.
Tips also boasted impressive financial metrics in 2023, with a return on invested capital (ROIC) of 345% and a return on equity (ROE) of 57.3%. In comparison, its competitor lagged significantly, with an ROIC of 24.3% and an ROE of 13.9%. A key differentiator was the relevance of Tips’ content, which resonated more with contemporary audiences, while the competitor’s catalog was older and less impactful. This was evident in the average revenue per person, where Tips generated Rs. 62,300 compared to the competitor’s Rs. 29,500.
Historically, high-growth and high-ROE companies such as Page Industries, Symphony, ENIL and Sun TV have traded at valuations of 100 P/E, positioning TIPS as an attractive opportunity. TIPS’ business model, characterized by highly sticky and repeatable content, has established it as a high-ROIC enterprise.
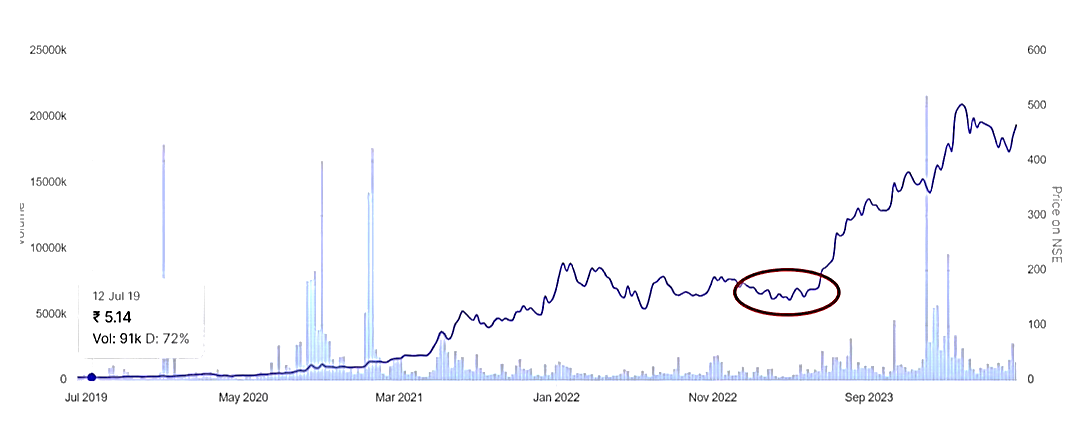
At the time of investment in 2023, Tips was trading at under 20 times forward P/E, with a growth guidance of over 30%. However, this valuation was not without its challenges. The stock had already rallied 30x, from Rs. 5 in 2019 to Rs. 150 in 2023, leading many investors to become anchored to historic prices. Furthermore, the market was overly concerned about issues such as corporate governance, capital allocation, piracy, and uncertainty surrounding OTT deals.
Source: Screener.in
Despite these worries, Tips’ stock surged from Rs. 150 in 2023 to over Rs. 400 by mid 2024 (and Rs. 800 by the end of 2024). This remarkable performance was driven by the company’s high ROIC, rooted in its strong business model, and its ability to deliver on growth expectations.
Margin of Safety and not losing sight of asymmetries
Positive and Inverse Correlations between Risk and Reward
Sometimes risk and reward are correlated in a positive fashion. If someone were to say to me, ‘I have here a six-shooter and I have slipped one cartridge into it. Why don't you just spin it and pull it once? If you survive, I will give you $1 million.’ I would decline - perhaps stating that $1 million is not enough. Then he might offer me $5 million to pull the trigger twice – now that would be a positive correlation between risk and reward!
The exact opposite is true with value investing. If you buy a dollar bill for 60 cents, it's riskier than if you buy a dollar bill for 40 cents, but the expectation of reward is greater in the latter case. The greater the potential for reward in the value portfolio, the less risk there is.
- Warren Buffet
Investors often shun out-of-favor stocks due to loss aversion, fearing that a stock trading at 40 cents on the dollar might drop further to 30 cents on the dollar. While this decline may happen, if one is convinced of the stock's intrinsic value, it presents a lucrative investment opportunity. In fact, such moments may even warrant buying more if the price drops further.
A helpful analogy can be drawn from tennis. A second serve is a player’s safety net after missing the first serve. To avoid a double fault, players often hit a slower, more controlled serve, prioritizing accuracy over aggression. This cautious approach, driven by loss aversion, has a tangible cost—second serves result in 10% fewer points won compared to first serves. Yet, elite players like Rafael Nadal (winning 57.3% of second-serve points) and Roger Federer (56.75%) demonstrate that skillful execution can mitigate this loss. Clearly, excessive caution tends to yield worse outcomes.
Never Waste a Good Crisis
History shows that times of distress often present the best opportunities to invest. Whether in market downturns or with individual stocks, significant price declines are typically followed by periods of exceptional returns. To capitalize on these opportunities, one must overcome loss aversion. Instead of retreating, being an aggressive buyer during a crisis can lead to substantial gains in the recovery phase.

Conclusion
Investing requires understanding that stocks are not just tickers on a screen but fractional ownership stakes in businesses. This perspective helps investors focus on the underlying value and quality of a company rather than being swayed by market noise. Successful investing hinges on identifying asymmetries through mispriced bets where the odds of success exceed the implied risks.
Valuation alone does not signal mispricing; a stock’s cheapness must align with its quality. High-quality companies often exhibit strong Return on Invested Capital (ROIC), a key metric indicating superior capital allocation and competitive advantage. ROIC serves as the clearest marker of a company’s potential for sustained value creation.
Investors should go beyond price charts to analyze factors driving stock movements, including shifts in fundamentals, industry dynamics, and macroeconomic influences. A disciplined focus on the margin of safety is essential, allowing investors to manage downside risks effectively. At the same time, avoiding loss aversion tendencies—the fear of short-term price drops—enables bold, rational decisions during periods of market stress or pessimism.
By combining an understanding of business fundamentals, valuation nuances, and behavioral discipline, investors can navigate uncertainty and capitalize on opportunities, ultimately leading to long-term wealth creation.
Already have an account? Log in
Want complete access
to this story?
Register Now For Free!
Also get more expert insights, QVPT ratings of 3500+ stocks, Stocks
Screener and much more on Registering.


 Download APP




Comment Your Thoughts: