“9.7….9.2…9.3…8.6…7.8…7.5…6.1…5.8….6...”
Numbers can be funny. They can leave a satisfactory smile on your face (when you see your paycheck) or leave you sweating (when you see your investments tumbling).
Though the numbers given above do not represent either, they represent something which is equally important if not more; something which can impact both your salary and investments! Yes! It shows India’s GDP growth rate and the phase when it dropped from 9.7% in March 2007 to 5.8% in December 2008. And the consequences of this drop: People lost their job, companies saw their toplines and bottom-lines being eroded, investments dried up and FIIs took their money and ran for cover. Most importantly retail investors lost their hard-earned money; only a lucky few could salvage some profits but most of the investors were left high and dry.
Take a look at the graph below to see the movement of the GDP growth rate and Sensex.
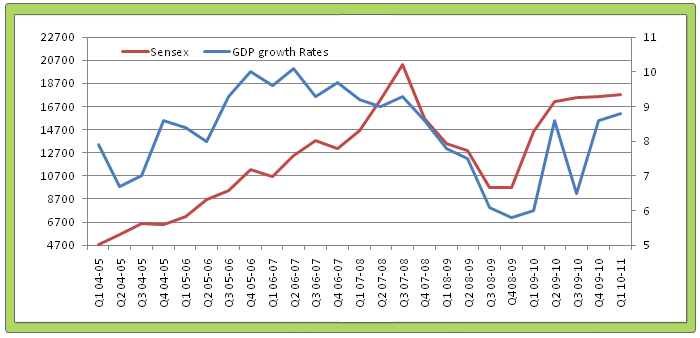
It is evident that there is positive correlation between the GDP growth rate and the movement of the Sensex. The Sensex falls with a falling GDP number and rises when the economy starts showing good numbers again.
So, how exactly does the growth or fall in GDP lead to a rise or fall in Sensex?
Before getting into the specific let’s understand few basic concepts to fully understand the impact of GDP.
What is GDP & how is it calculated?
GDP (Gross Domestic Product) is the sum total of value of all the goods and services produced in an economy during a given year. In short, it is the X-Ray report of how the economy is performing. GDP is the most crucial economic indicator which tells us about the health of our economy. It can help companies decide on what strategies they should adopt as also indicate to the policy makers, the effectiveness of the steps and decisions they have undertaken.
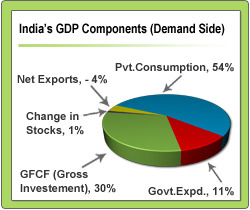
Usually in most countries GDP is computed via the expenditure method. The expenditure approach is based on the logic that all what is produced must be bought by somebody. In the expenditure method GDP is calculated as the sum total of private consumption (C), government expenditure (G), gross investment (I) made in the country, change in stocks and net exports i.e. total exports – total imports of the country (X - M)
In equation form you can express it as
GDP = C + G + I + (X – M)
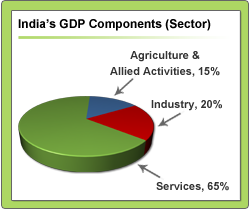
Another way of looking at GDP is by classifying it under sectoral contribution. Under this, the GDP is taken as the total value of goods produced by three major sectors: Agriculture and allied activities, Industry & Services. The service sector which includes sub segments like transport, insurance, finance, communication, construction etc. contributes a large share to the GDP in India. Similarly growth in Industry and its sub segments like manufacturing, mining, electricity etc are crucial for the growth of the GDP.
So, why do you need to know about these classifications? These classifications can help you understand the changes in the components of GDP which can actually tell you where the economy is headed. This in turn can help you invest profitably in the markets.
Let us now see how changes in GDP and its components can impact the economy and stock market.
Analyzing the GDP and its impact on the economy and Stock Market:
GDP has a massive impact on almost all the economic factors in a country. Even a small change in GDP can have far reaching affects on the economy. Let us see how.
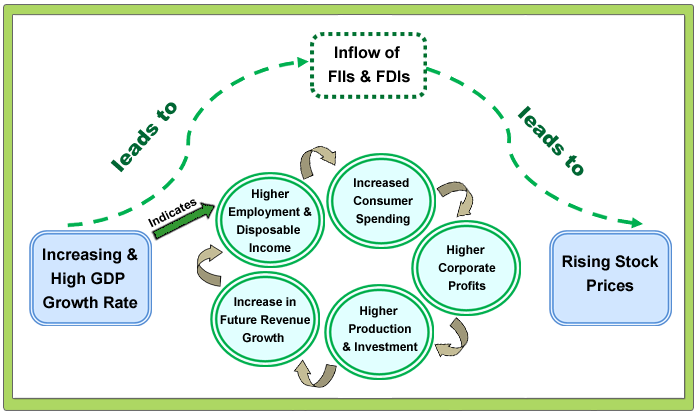
You can see from the above diag. the impact of increasing and higher GDP growth rate. Over the last 5-6 years the GDP of our country has been growing at a healthy rate of over 8% (average) annually. With a growing economy, India has seen higher employment opportunity for the people which have led to an increase in their disposable income. With higher demand in place, companies have seen a surge in their profits leading to a rise in their stock prices. To cater to the increasing demand, companies have also increased their investment activities adding new plants, factories, offices etc. This adds to the future expectation of revenue growth of the companies which if sustained can lead to further increase in the stock prices.
Now a booming economy with consistent high GDP growth rates is what attracts foreign investment in the form of FDIs and FIIs. With one of the highest GDP growth rates over the last few years, India has also experienced one of the highest Net FII inflows in the world which has led to stock market surging from 6000 level in early 2000 to present level of 20000. (To know the full impact of FII on your stocks read Stock Shastra # 32)
So, what should you look at in the GDP report?
Understanding the components, computations and the impact of GDP can help you make intelligent investments and profit in the stock market. The GDP report is very comprehensive considering that it gives out some of the most crucial information which would help you know where a particular industry, sector and economy is headed. Here are a few questions that you need to find answers to from the GDP report.
Where is the consumer spending headed? The consumer spending or Pvt. Consumption expenditure makes up 60% of the total GDP (expenditure side). You can also find out beforehand where the demand situation in the economy is headed by looking at a) Your own consumption pattern and the people around you b) changes in monthly auto sales figures etc. Lower consumption demand impacts sectors like real estate, auto, banking etc the most. (for more analysis on consumer demand read our blog on Consumer Spending)
Where is the IIP headed? IIP (Index of Industrial Production) is one of the leading indicators of the economy which is published by the government every month. If the industrial production is rising then it is likely that the GDP numbers are going to be good. In the monthly published bulletin on the official website of RBI you can check the IIP data and also the industry wise growth. To know how you can profit from IIP data read our blog
Is the GDP growing on the backdrop of higher government spending? Government spending is essential for maintaining the socio-economic framework for the country. In 2008-09 when the economy was going through one of its worst phase, govt. increased its spending by 56% in Dec 2008 so that the economy could revive and demand situation could pick up. Remember, govt. cannot continue high expenditure forever, so the growth in GDP is sustainable when it is backed by growth in key sectors like infrastructure, mining, manufacturing, services etc.
Is the agriculture sector growing? The agriculture sector (contributing approx. 15% to the GDP) is greatly affected by factors like rainfall, quality of seeds, fertilizer subsidy, interest rate for marginal farmers etc. Lack of rain or untimely rain can lead to lower agricultural production which could lead to lower GDP growth. Also, it supports more than 50% of India’s population which forms a large chunk of the demand position in the economy. Unfavorable agriculture production can also have an indirect impact of pulling the overall demand in the economy down.
Is the investment demand still strong? Long term growth of the economy is dependent on investment activities undertaken by both government and private sector. Investment demand has a 30% share in the GDP. During the downturn the growth rate in investment came down from 12.5% in Sep 2008 to 1.6% in Sep 2009. If the interest rate is continuously increasing then you might witness a slowdown in investments.
Where are the indicators of service sector activity pointing to? Look for a section on “Indicators of Service Sector Activity” in the Quarterly Review of Monetary & Macroeconomic Development available on RBI’s official website. It gives you important information like growth rate in tourist arrival, cell phone connections, commercial vehicle production etc which could be crucial indicators for industries like hotel & tourism, telecom etc.
The GDP report can thus reveal all the facts about the economy, production, income, saving, investment etc which could prove beneficial in knowing which sectors or industry you should invest in.
Already have an account? Log in
Want complete access
to this story?
Register Now For Free!
Also get more expert insights, QVPT ratings of 3500+ stocks, Stocks
Screener and much more on Registering.






Comment Your Thoughts: