


Every month the newspapers invariably carry either of the following two headlines: ‘Sensex rises on strong IIP growth’ or ‘Sensex tumbles on weak IIP data’. Analysts and economists wait with bated breath for every month’s IIP figures. As retail investors, most of us may not be aware of what IIP really is but have seen it frequently impact the Stock market. So, learning about this important economic indicator can help us profit in the stock market. Let’s see what IIP is all about.
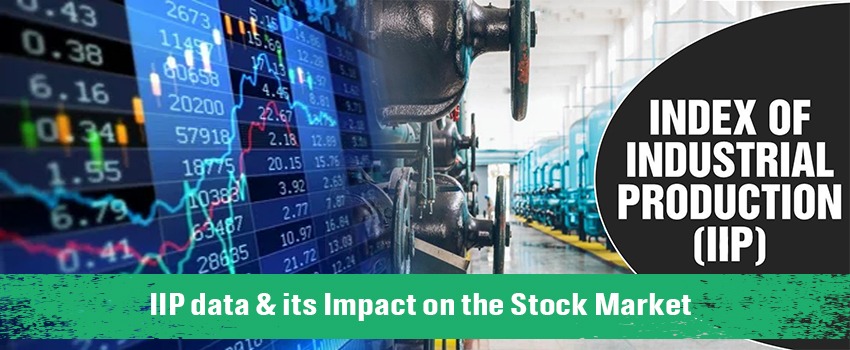
What is IIP & why is it so important to you?
IIP (Index of Industrial Production) denotes the total production activity that happens in the country during a particular period as compared to a reference period. It helps us to understand the general level of industrial activity in the economy. The products included for calculation of IIP can be segregated into 3 major sectors – Manufacturing (79.36%), Mining & Quarrying (10.47%) and Electricity (10.17%). Another way of categorizing the items used in the calculation of IIP is a ‘Use based classification’ with categories like Basic Goods, Capital goods, Intermediate goods, Consumer durables and Non-consumer durables.
Now, that we know what IIP is, why is it so important?

The chart given above shows the movement of Sensex and IIP over the last 4 years. It is quite evident that the IIP and Sensex movement is closely related. The IIP data is not as volatile as the Sensex but even a 2-3% change in IIP can lead to a lot of swing in stock market movement. There are many other factors that impact the stock market, but IIP gives a very good indication of where it is headed. Consider for example the period from January 2010 to April 2010. The rise in IIP during this period has been reflected in the upward movement which saw Sensex touching 20,000 in September this year.
Thus, IIP can drive the stock market up or down. But how does IIP actually affect the stock markets and subsequently the economy?
Why/How is IIP the lifeline of Economy & Stock Market?
The relationship between the IIP and the stock market is backed by a whole chain of events.
In our blog on Consumer Spending, we learnt that consumer spending is indicative of the demand in the economy. IIP, on the other hand, indicates the total production in the economy and is the other side of the coin i.e. the Supply side.
")
The diagram given above shows how lower IIP – which usually results due to lower consumer spending - can lead to a drop in stock prices.
Depleted consumer sentiment leads to a fall in consumer spending consequently leading to lower demand in the economy. If we are not buying more then why would companies produce more!! This leads to lower growth or sometimes even a de-growth in IIP. Thus, usually the immediate impact of poor IIP figures is falling stock prices.
Over the long term, continuous lower consumption leads to lower producer confidence. Negative sentiment about future demand further leads to reduction in investment activity & hence slows down the capital spending. This has an adverse impact on future sales & profits of the companies. Thus, the negative sentiment leads to an adverse investment atmosphere for both institutional and retail investors.
Lower supply coupled with lower demand can have catastrophic impact on stock market and was one of the main reasons for drop in Sensex from 20000 to 8000 in 2008. Thus, lower IIP is bad news for the Stock Market as well as for the growth of the economy.
So is IIP just about overall production or does it give us an in depth picture of different industries?
Complete Picture of IIP – Analysis of composite Industries
The best way to analyse the IIP figure is to look at the various industries and their growth. Manufacturing sector contributes approx. 80% to the IIP that is why it has the most impact on stock market. You might hear that IIP recorded good growth of 10.8% in Oct. 2010, but the story may not be the same for every industry. Let us look which industries we need to look at to completely understand the IIP figure.
Chemical & Related Products- Good growth in this sector means that companies producing chemicals are likely to perform well. Also, check growth in user industries like Pharma, textiles, paper & leather. For instance, the chemical sector grew by 10% in April 2010 (annual growth in production) but the growth in user industry like textile, leather & paper was lower. Thus it can be deduced that the growth is coming from Pharma sector which will likely be reflected in the next few quarters’ performance.
Automobiles- Monthly sales data would give you a good picture of where the industry is headed. A continuous increase in production can be a good indication of an improved performance by the major auto companies in the coming quarter.
Cement Sector- Growth in IIP is good news for the cement sector as it is hugely dependant on infrastructure & real estate for its demand. Usually the cement manufacturers ramp up their capacity during times of high demand. However, a slowdown can lead to an oversupply situation in the industry impacting their realizations and profits in the short run as well as the long run. So, it is important to check whether the demand has been growing consistently or not.
Mining Sector- Mining Sector contributes approx 10% to the IIP. Growth figures can tell us in advance about how mining companies (like MOIL, Coal India), steel companies like (Tata Steel, SAIL etc.) are going to fare in coming quarters.
As mentioned before, there is also a ‘Use-based classification’ which can give you further insights about the growth in production of different sectors. For example if the consumer non-durable goods segment has been growing remarkably in say past 5-6 months. This would usually lead to FMCG companies posting impressive quarterly and annual performances.
The IIP does not include growth of banking sector. However increase in production & investment activity is usually financed through borrowings from banks. So, if industrial production & capital spending is increasing then it is likely to have a positive impact on the banking sector.
So, how can you use IIP data to profit in the Stock Market?
In India IIP is released with a lag of 2 months. For instance the October 2010 IIP data is made available only in December 2010. Yet, the IIP data can give us much crucial information which can help us in our stock investments. Here are a few pointers to best utilize the knowledge of the IIP to profit in the Stock market.
Check the industry wise growth. A sustained fall in growth in a specific industry could be a good time to exit that industry and allocate your funds in stocks of a better performing industry.
If good IIP data is backed by buoyant consumer demand then announcements like capacity expansion, building of new factories etc. by companies you are tracking indicate a good future flow of income and hence an upside to their stock prices.
A continuous fall in overall IIP data may lead to many fundamentally strong stocks being undervalued. This gives you the perfect opportunity to invest in fundamentally strong companies at discount price.
If growth in IIP is backed by higher investment activity and also lending by the banks, then banking sector is likely to experience good growth. However, lower IIP growth could impact the banking sector adversely.
Thus, IIP gives you the overall picture of production activity in India and has the might of altering the course of stock market movement.
Already have an account? Log in
Want complete access
to this story?
Register Now For Free!
Also get more expert insights, QVPT ratings of 3500+ stocks, Stocks
Screener and much more on Registering.


Comment Your Thoughts: