Stocks - Q : Quality | V : Valuation | PT : Price Trend
Funds - P : Performance | Q : Quality
Funds - P : Performance | Q : Quality


Past 10 year's financial track record analysis by Moneyworks4me indicates that Dollar Industries Ltd is a average quality company.
The key valuation ratios of Dollar Industries Ltd's currently when compared to its past seem to suggest it is in the Overvalued zone.
The Price Trend analysis by MoneyWorks4Me indicates it is Semi Strong which suggest that the price of Dollar Industries Ltd is likely to Rise-somewhat in the short term. However, please check the rating on Quality and Valuation before investing.
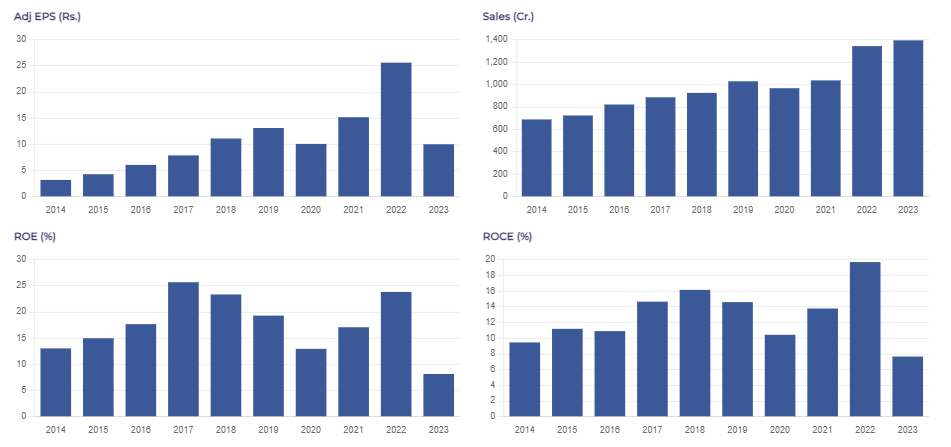
Data adjusted to bonus, split, extra-ordinary income, rights issue and change in financial year end.
Value Creation Index Colour Code Guide ⓘ
| Mar'15 | Mar'16 | Mar'17 | Mar'18 | Mar'19 | Mar'20 | Mar'21 | Mar'22 | Mar'23 | Mar'24 | TTM | |
|---|---|---|---|---|---|---|---|---|---|---|---|
| ROCE % ⓘ | 0% | 0% | 0% | 21.3% | 21.7% | 14.7% | 19% | 27.2% | 9.3% | 14.5% | - |
| Value Creation Index ⓘ | NA | NA | NA | 0.5 | 0.6 | 0.1 | 0.4 | 0.9 | -0.3 | 0.0 | - |
Growth Parameters ⓘGrowth Parameters Colour Code Guide ⓘ | |||||||||||
| Sales ⓘ | 0 | 0 | 0 | 926 | 1,029 | 967 | 1,037 | 1,343 | 1,394 | 1,572 | 1,661 |
| Sales YoY Gr. | - | NA | NA | NA | 11.2% | -6% | 7.2% | 29.5% | 3.8% | 12.8% | - |
| Adj EPS ⓘ | 0 | 0 | 0 | 11.1 | 12.8 | 9.7 | 14.8 | 25.4 | 9 | 15.6 | 16.7 |
| YoY Gr. | - | NA | NA | NA | 16% | -24.3% | 52.7% | 71.5% | -64.5% | 73.2% | - |
| BVPS (₹) ⓘ | 0 | 0 | 0 | 62.1 | 73.3 | 81.3 | 94.6 | 118.3 | 124.7 | 137.7 | 145.6 |
| Adj Net Profit ⓘ | 0 | 0 | 0 | 62.7 | 72.8 | 55.1 | 84.1 | 144 | 51.2 | 88.6 | 95 |
| Cash Flow from Ops. ⓘ | 0 | 0 | 0 | -31.1 | 0.8 | 52.9 | 132 | 0.3 | 136 | -25.6 | - |
| Debt/CF from Ops. ⓘ | 0 | 0 | 0 | -5.9 | 266.7 | 4 | 0.9 | 597.2 | 1.2 | -12 | - |
CAGR Colour Code Guide ⓘ
| 9 Years | 5 Years | 3 Years | 1 Years | |||||
|---|---|---|---|---|---|---|---|---|
| Sales ⓘ | NA | 8.9% | 14.9% | 12.8% | ||||
| Adj EPS ⓘ | NA | 4% | 1.8% | 73.2% | ||||
| BVPSⓘ | NA | 13.5% | 13.3% | 10.4% | ||||
| Share Price | - | 27% | -13.6% | -30.7% | ||||
Performance Ratio Colour Code Guide ⓘ
| Mar'15 | Mar'16 | Mar'17 | Mar'18 | Mar'19 | Mar'20 | Mar'21 | Mar'22 | Mar'23 | Mar'24 | TTM | |
|---|---|---|---|---|---|---|---|---|---|---|---|
| Return on Equity % ⓘ | 0 | 0 | 0 | 17.8 | 19 | 12.6 | 16.9 | 23.9 | 7.4 | 11.9 | 11.8 |
| Op. Profit Mgn % ⓘ | 0 | 0 | 0 | 13.4 | 13.3 | 10.9 | 13.4 | 16.5 | 7.1 | 10.2 | 11 |
| Net Profit Mgn % ⓘ | 0 | 0 | 0 | 6.8 | 7.1 | 5.7 | 8.1 | 10.7 | 3.7 | 5.7 | 5.7 |
| Debt to Equity ⓘ | 0 | 0 | 0 | 0.5 | 0.5 | 0.5 | 0.2 | 0.3 | 0.2 | 0.4 | - |
| Working Cap Days ⓘ | 0 | 0 | 0 | 0 | 240 | 280 | 263 | 239 | 250 | 235 | 107 |
| Cash Conv. Cycle ⓘ | 0 | 0 | 0 | 0 | 166 | 194 | 182 | 163 | 171 | 165 | 53 |
Sales growth is growing at healthy rate in last 3 years 14.88%
Sales growth is good in last 4 quarters at 11.97%
Return on Equity has declined versus last 3 years average to 11.80%
Net Profit has been subdued in last 3 years 1.75%
| Standalone | Consolidated | |
|---|---|---|
| TTM EPS (₹) | 16.1 | 16.7 |
| TTM Sales (₹ Cr.) | 1,634 | 1,661 |
| BVPS (₹.) ⓘ | 146.9 | 145.6 |
| Reserves (₹ Cr.) ⓘ | 839 | 814 |
| P/BV ⓘ | 2.65 | 2.67 |
| PE ⓘ | 24.12 | 23.25 |
| From the Market | |
|---|---|
| 52 Week Low / High (₹) | 350.00 / 660.10 |
| All Time Low / High (₹) | 94.00 / 665.70 |
| Market Cap (₹ Cr.) | 2,206 |
| Equity (₹ Cr.) | 11.3 |
| Face Value (₹) | 2 |
| Industry PE ⓘ | 33.4 |
| Jun'24 | YoY Gr. Rt. % | Sep'24 | YoY Gr. Rt. % | Dec'24 | YoY Gr. Rt. % | Mar'25 | YoY Gr. Rt. % | |
|---|---|---|---|---|---|---|---|---|
| Operating Income | 0 | N/A | 0 | N/A | 0 | N/A | 0 | N/A |
| Adj EPS (₹) | N/A | N/A | N/A | N/A | N/A | N/A | N/A | N/A |
| Net Profit Mgn % | N/A | N/A | N/A | N/A | N/A | N/A | N/A | N/A |
Dollar Industries is expanding its distributor network under Project Lakshya, adding 17 new distributors in H1 FY25, and increasing the total to 307. This initiative aims to enhance domestic sales growth, which rose from 26% in FY24 to 31% in H1 FY25.
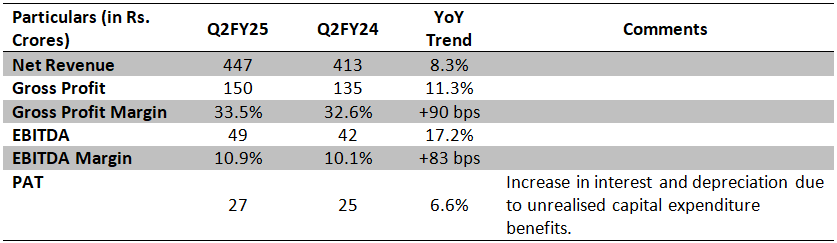
The company experienced strong demand for thermal products due to a forecasted longer winter season, with thermal wear contributing approximately 10% to revenue.
The Force NXT product line saw significant growth, accounting for about 5% of revenue with a 30% increase in value and a 38% increase in volume year-on-year.
E-commerce and modern trade channels contributed around 7.5% to total sales, up from 3.6% in Q2 FY24.
Management expressed confidence in achieving their guidance of 12% to 13% growth in operating income for the fiscal year, with expectations that the second half will outperform the first half historically. They anticipate that continued focus on strategic initiatives and product mix improvements will drive profitability growth moving forward.
MoneyWorks4Me Opinion
Growth under pressure but margin remains strong. Overall guidance maintained.
Q1FY25 Concall Highlights:
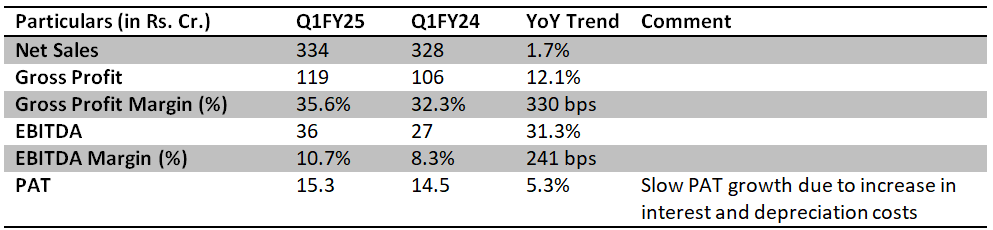
Sales: Volume degrowth was 5% and value growth was overall 7% for Q1 FY25, including a 2% increase in Average Selling Price. Sales growth was slow due to the implementation of SAP ERP systems, which has replaced Oracle financial ERP system. This led to a loss of about 25 days’ worth of sales. The impact is expected to reverse in the subsequent quarters. South Indian market (9% of Q1FY25 Sales) is expected to grow by 40% for the full financial year.
Margin: The company aims to maintain 35-36% Gross Margins and 11-11.5% EBITDA Margins.
Cash Conversion Cycle: While the cash conversion cycle has temporarily worsened due to inventory buildup for the following quarters, the company expects the cash conversion cycle to be at 135 days by March 2025.
Distribution: The Lakshya Project continues to do well and overall revenue contribution is expected to increase from 26% in FY24 to 36% in FY25.
Dollar Industries is a high quality innerwear business which has historically grown at a higher rate than the competition. We expect:
However, raw material volatility remains a key risk for the company due to the price sensitive nature of its consumer base and the willingness of competitors to lower prices in periods where raw material price reduces. Such impacts are short term and business normalizes as higher priced inventory is cleared from books.
Please refer to the Initiating Coverage for further details on the company.
Dollar Industries Limited (DIL) was founded as Bhawani Textiles in 1973, and is a leading Indian Innerwear manufacturer with a 15% market share in the organized market. The company markets its products under brands such as Big Boss, Force NXT and Lehar, which cater to the economy and mass market segments.
The company has 4 facilities at Ludhiana, Tirupur, Kolkata, and Delhi. The manufacturing is supplemented with an extensive pan-India dealer network of more than 1500 dealers that cater to more than 145,000 retailers across 29 states. The company additionally has 18 Exclusive Brand Outlets.
The company derives 83% of its revenue from menswear, and derives 14% and 3% of its revenue from women’s and children’s clothing respectively. 81% of the company’s revenues are derived from innerwear, while the remaining is derived from outerwear such as athleisure. The company sells products across India, with 44% sales from the North, 23% from East and West respectively, and 10% from the South; along with exports to countries such as Oman, Jordan, Qatar, Kuwait, Bahrain, Yemen, Iraq, Myanmar, Nepal, Nigeria and U.A.E. which contribute 5% to the total revenue.

Source: Dollar Industries Q3FY24 Investor Presentation
The business relies heavily on celebrity endorsements to drive sales, which leads to high advertising and promotion costs. The company spent Rs 101 crores in FY23 (7.3% of revenue) on advertising and promotion by retaining celebrities such as Saif Ali Khan, Akshay Kumar, and Yami Gautam.
The Indian Innerwear Industry is dominated by players such as Page Industries (Jockey), Lux Industries, Dollar Industries, Rupa & Company in the listed space and JG Hosiery (Macho), Dixcy Textiles (Dixcy Scott) and V-Star in the unlisted space. The innerwear market is dominated by a large number of small unorganized players which, as a total, make up 60% of the total market. While unorganized players lack distribution and competitive pricing power, their existence hinders the growth of larger players that target lower-income demographics.
Between FY18 and FY23, the company has grown its revenues at an annualized rate of 8.5%, while PAT has fallen at an annualized rate of 4% owing to slowing sales in FY23 and during Covid-19 and the high cost of raw materials respectively. However, the raw material pressure has eased off over the last few quarters, which has led to an improvement in gross margins and inventory destocking in the channel.
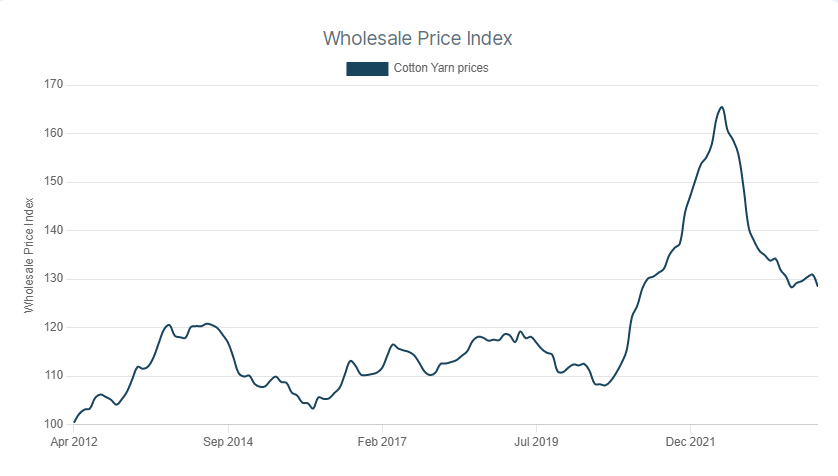
Source: Office of Economic Adviser
While FY23 witnessed high raw material prices and low gross margins, 9MFY23 has shown an improvement in gross margins that are expected to be sustained over a long period.
(In Rs. Million)
Source: Dollar Industries Q3FY24 Investor Presentation
We believe that the future prospects of the company would look remarkably different from the past due to changes in the distribution model which would have an exponential impact on growth, margins, and working capital requirements. The company has hired Vector Consulting to implement a pull-based distribution strategy (called Project Lakshya) under the theory of constraints framework, which would result in improved capital efficiency at the retail, distributor, and company level if successfully implemented. Our thesis is based on the following points:

Source: Dollar Industries Q3FY24 Investor Presentation
| Company Name | CMP(₹) | |||||||
|---|---|---|---|---|---|---|---|---|
| PDS | 393.7 | -8.2 (-2%) | Small Cap | 10,577 | 11.5 | 3.2 | 35 | 3.5 |
| Welspun Living | 130.7 | -2.6 (-1.9%) | Small Cap | 9,679 | 6.8 | 6.9 | 19.6 | 2.7 |
| Vardhman Textiles | 486.8 | -10.6 (-2.1%) | Small Cap | 9,299 | 28.9 | 5.9 | 17.2 | 1.5 |
| Arvind | 391.6 | 2.9 (0.7%) | Small Cap | 7,738 | 11.5 | 4.5 | 33.8 | 2.8 |
| K.P.R. Mill | 1,035.5 | -42.8 (-4%) | Small Cap | 6,060 | 24.1 | 13 | 44.7 | 7.6 |
| Alok Inds | 18.5 | -0.2 (-0.9%) | Small Cap | 5,356 | -1.6 | -15.2 | - | -0.5 |
| RSWM | 158.7 | 2.4 (1.5%) | Small Cap | 4,058 | -1.2 | -2 | - | 0.6 |
| Indo Count Inds | 311.2 | 2.2 (0.7%) | Small Cap | 3,557 | 16.5 | 9.1 | 18.7 | 2.7 |
| Himatsingka Seide | 154.7 | 2.7 (1.8%) | Small Cap | 2,841 | 7 | 3.9 | 21.8 | 0.9 |
| Sangam India | 422.7 | 2.3 (0.5%) | Small Cap | 2,648 | 6.1 | 1.5 | 68.9 | 2.1 |
| PARTICULARS | Mar'18 | Mar'19 | Mar'20 | Mar'21 | Mar'22 | Mar'23 | Mar'24 |
|---|---|---|---|---|---|---|---|
| Sales | 926 | 1,029 | 967 | 1,037 | 1,343 | 1,394 | 1,572 |
| Operating Expenses ⓘ | 801 | 892 | 861 | 899 | 1,122 | 1,295 | 1,413 |
| Manufacturing Costs | 209 | 235 | 208 | 231 | 292 | 249 | 371 |
| Material Costs | 406 | 434 | 448 | 445 | 615 | 758 | 725 |
| Employee Cost | 26 | 30 | 42 | 45 | 64 | 77 | 89 |
| Other Costs ⓘ | 160 | 194 | 163 | 177 | 152 | 211 | 227 |
| Operating Profit ⓘ | 124 | 136 | 106 | 138 | 221 | 99 | 160 |
| Operating Profit Margin (%) | 13.4% | 13.3% | 10.9% | 13.3% | 16.4% | 7.1% | 10.2% |
| Other Income ⓘ | 2 | 2 | 5 | 3 | 7 | 5 | 4 |
| Interest ⓘ | 18 | 16 | 16 | 9 | 10 | 15 | 20 |
| Depreciation ⓘ | 12 | 11 | 14 | 15 | 17 | 18 | 21 |
| Exceptional Items ⓘ | 0 | 0 | 0 | 0 | 0 | 0 | 0 |
| Profit Before Tax ⓘ | 96 | 111 | 80 | 117 | 198 | 66 | 122 |
| Tax ⓘ | 32 | 36 | 20 | 30 | 51 | 13 | 30 |
| Profit After Tax | 64 | 75 | 59 | 87 | 147 | 52 | 91 |
| PAT Margin (%) | 6.9% | 7.3% | 6.1% | 8.4% | 11.0% | 3.8% | 5.8% |
| Adjusted EPS (₹) | 11.2 | 13.0 | 10.1 | 15.0 | 25.9 | 9.3 | 15.9 |
| Dividend Payout Ratio (%) | 14% | 13% | 17% | 16% | 12% | 32% | 19% |
| PARTICULARS | Mar'18 | Mar'19 | Mar'20 | Mar'21 | Mar'22 | Mar'23 | Mar'24 | |||
|---|---|---|---|---|---|---|---|---|---|---|
Equity and Liabilities | ||||||||||
| Shareholders Fund | 352 | 416 | 461 | 537 | 671 | 707 | 781 | |||
| Share Capital ⓘ | 11 | 11 | 11 | 11 | 11 | 11 | 11 | |||
| Reserves ⓘ | 341 | 404 | 449 | 525 | 660 | 696 | 770 | |||
| Minority Interest | 0 | 0 | 0 | 0 | 0 | 2 | 3 | |||
| Debt | 170 | 211 | 208 | 124 | 206 | 161 | 302 | |||
| Long Term Debt | 45 | 3 | 3 | 2 | 1 | 0 | 30 | |||
| Short Term Debt | 125 | 208 | 205 | 122 | 205 | 161 | 272 | |||
| Trade Payables | 113 | 147 | 120 | 139 | 176 | 138 | 182 | |||
| Others Liabilities ⓘ | 65 | 71 | 50 | 66 | 100 | 84 | 105 | |||
| Total Liabilities ⓘ | 700 | 846 | 840 | 866 | 1,153 | 1,091 | 1,373 | |||
Fixed Assets | ||||||||||
| Gross Block | 95 | 108 | 126 | 153 | 174 | 197 | 351 | |||
| Accumulated Depreciation | 27 | 38 | 52 | 67 | 84 | 100 | 121 | |||
| Net Fixed Assetsⓘ | 68 | 70 | 74 | 85 | 91 | 97 | 230 | |||
| CWIP ⓘ | 2 | 2 | 14 | 15 | 52 | 88 | 17 | |||
| Investmentsⓘ | 3 | 6 | 7 | 5 | 5 | 2 | 0 | |||
| Inventories | 283 | 325 | 305 | 334 | 475 | 358 | 487 | |||
| Trade Receivables | 272 | 348 | 360 | 331 | 402 | 428 | 493 | |||
| Cash Equivalents | 20 | 22 | 6 | 7 | 1 | 1 | 2 | |||
| Others Assetsⓘ | 52 | 74 | 74 | 89 | 127 | 117 | 144 | |||
| Total Assets ⓘ | 700 | 846 | 840 | 866 | 1,153 | 1,091 | 1,373 | |||
| PARTICULARS | Mar'18 | Mar'19 | Mar'20 | Mar'21 | Mar'22 | Mar'23 | Mar'24 |
|---|---|---|---|---|---|---|---|
| Cash Flow From Operating Activity ⓘ | -31 | 1 | 53 | 132 | 0 | 136 | -26 |
| PBT ⓘ | 95 | 109 | 78 | 115 | 198 | 66 | 122 |
| Adjustment ⓘ | 31 | 28 | 34 | 28 | 30 | 38 | 44 |
| Changes in Working Capital ⓘ | -122 | -92 | -34 | 19 | -183 | 61 | -165 |
| Tax Paid ⓘ | -36 | -45 | -25 | -30 | -45 | -28 | -26 |
| Cash Flow From Investing Activity ⓘ | -11 | -16 | -25 | -22 | -62 | -58 | -80 |
| Capex | -8 | -13 | -22 | -23 | -59 | -55 | -82 |
| Net Investments | -3 | -4 | -3 | 0 | -3 | -3 | 1 |
| Others ⓘ | 1 | 1 | 0 | 1 | 0 | 0 | 0 |
| Cash Flow From Financing Activityⓘ | 51 | 16 | -43 | -109 | 55 | -79 | 108 |
| Net Proceeds from Shares ⓘ | 108 | 0 | 0 | 0 | 0 | 2 | 0 |
| Net Proceeds from Borrowing ⓘ | -28 | -41 | -11 | -1 | -2 | -2 | 30 |
| Interest Paid ⓘ | -18 | -16 | -15 | -9 | -9 | -14 | -16 |
| Dividend Paid ⓘ | -5 | -9 | -10 | -10 | -14 | -17 | -17 |
| Others ⓘ | -5 | 83 | -7 | -90 | 79 | -48 | 111 |
| Net Cash Flow ⓘ | 9 | 1 | -15 | 1 | -7 | 0 | 2 |
| PARTICULARS | Mar'18 | Mar'19 | Mar'20 | Mar'21 | Mar'22 | Mar'23 | Mar'24 | |||
|---|---|---|---|---|---|---|---|---|---|---|
| Ratios | ||||||||||
| ROE (%) | 18.17 | 19.6 | 13.57 | 17.5 | 24.36 | 7.61 | 12.28 | |||
| ROCE (%) | 21.29 | 21.7 | 14.68 | 18.99 | 27.15 | 9.25 | 14.45 | |||
| Asset Turnover Ratio | 1.32 | 1.33 | 1.15 | 1.22 | 1.33 | 1.24 | 1.28 | |||
| PAT to CFO Conversion(x) | -0.48 | 0.01 | 0.9 | 1.52 | 0 | 2.62 | -0.29 | |||
| Working Capital Days | ||||||||||
| Receivable Days | 107 | 110 | 134 | 122 | 100 | 109 | 107 | |||
| Inventory Days | 112 | 108 | 119 | 112 | 110 | 109 | 98 | |||
| Payable Days | 101 | 110 | 109 | 106 | 94 | 76 | 81 | |||

MoneyWorks4Me rating and ranking of funds for SIP is available to subscribers only. Moneyworks4Me is not a rating and ranking agency, however it is required that users have a way of selecting funds and building a Portfolio. The method used by it are described below to enable users to understand the logic behind the rating and ranking Subscriber will find more details on this in the various content made available from time to time. In case you need more please write to besafe@moneyworks4Me.com
MoneyWorks4Me rates and ranks mutual funds based on the following data-driven system:
Funds ranking in screeners: Performance Consistency and Quality are two parameters used for ranking funds for SIP. The ranking as follows GG, GO, GR, OG, OO, OR, RG, RO and RR.
With the same color-coded funds, the one with the higher Average 3-year rolling returns (over 5 to 10 years), the number that appears in the Performance tag, ranks higher.
Here is the summary:
The third tag Upside Potential is not relevant for SIP. It is relevant for lumpsum investments in Mutual Funds.

A 5-Step Journey to Financial Freedom
Read this Book for Free.*This Offer is only valid till this month only. Claim it now.
Read NowDid you know that market corrections can actually present great opportunities to buy high-quality stocks at discounted prices? By taking advantage of these times of volatility, you can position your portfolio for long-term growth.
At MoneyWorks4me Portfolio Advisory, we specialize in helping investors navigate market fluctuations and build a strong, diversified portfolio. With our collaborative approach, you can maintain control over your investments while benefiting from our expertise and guidance.
If you're interested in learning more and with a minimum portfolio size of 25 L+, we can help you manage your portfolio, no matter the size. let's connect and discuss how we can work together. And as a bonus, we're offering a FREE Portfolio Review using our "Portfolio Manager" tool during our conversation.
So why wait?
Let's get started today and take your portfolio to the next level!
#Limited slots available.

Do you want to Invest in Undervalued Handpicked stocks and earn high Returns?

Winning and long lasting portfolio is made of Quality Stocks, but how simple is that?

As an Investor most important decision making questions are?

Make an informed decision for Stocks
Invest using an intelligent system with powerful data-driven tools that help you identify opportunities and make informed buy-hold-sell decisions
Buy quality Stocks when they are available at reasonable prices and supported by an upward price trend and Sell when they are Overvalued using the Decizen Rating System. Covers 3500+ stocks

Make an informed decision for Funds
*Color code for outperformance consistency
*Number is average 3 year rolling returns

Want to invest successfully in stocks?
How the heck do you select a solution that ensures it?
Check how good is your current solution!Does it get you focused on meeting your financial goals?

Does it get you focused on meeting your financial goals?
Investing is to means to funding your goals. Your solution must help you get clarity of your goals and how you should invest to reach them. Does your solution include Financial Planning?
Does it have a way of investing that you are confident will work for you?
Does it have a way of investing that you are confident will work for you?
Are you clear of the rationale behind recommendations?
Do you have a way of answering the most important questions: Which stocks are worth investing in, at what price and how do you build your portfolio?

Does it make it easy to find opportunities without wasting your time?

Does it make it easy to find opportunities without wasting your time?
Does it share the tools to enable decision making transparently?
Does it share the tools to enable decision making transparently?
Finally stock investing is all about make informed decisions.
Does your solution provide easy-to-use decision enabling data, information and tools?

Does it help you become a better investor

Does it help you become a better investor


Account Discovery
- OTP from CAMS
Account Linking for Stocks & MF
- One OTP per link Eg. NSDL, CDSL, CAMS, KFin etc.
One Click Upload for your Current Portfolio and Future Transactions!
Take control of your financial future and start building your ideal portfolio today
- with reliable research at your fingertips.
Unlock the Power of Core Superstars Now →

 Download APP


